OVERVIEW OF THE 1998 MISSION PEAK LANDSLIDE
FREMONT, CALIFORNIA
J. David Rogers 1 and Patrick L. Drumm 2
1 UM-Rolla Dept. of Geological Engineering
129 McNutt Hall, 1870 Miner Circle, Rolla, MO 65409
e-mail rogersda@umr.edu
2
1. INTRODUCTION
2. SITE CONDITIONS
a. Topography
b. Seismicity
c. Mission Fault
d. Warm Springs Fault
e. Unnamed Fault
f. Impact of Faults on 1998 Landslide
3. GEOLOGIC CONDITIONS
a. Structural Geology and Underlying Bedrock Units
b. Preliminary Conclusions Regarding Geologic Structure
4. HYDROLOGY
a. Rainfall Patterns
b. Runoff Hydrology
5. 1998 MISSION PEAK LANDSLIDE
a. Evidence of Historic Seismically-induced Movement
b. Perturbed Channel Profile
c. Recent Channel Offsets
d. Geometry of the 1998 Landslide Complex
e. Apparent Offset of Landslide by the Underlying Mission Fault
6. IMPACT OF PREVIOUS LANDSLIDE MAPPING ON LAND USE PLANNING
a. Adjacent Slide Complex
b. Geologic Conditions Promoting Failure
7. LANDSLIDE HAZARD MAPPING UNDERTAKEN IN 1998
8. CONCLUSIONS REGARDING THE LIKELY FAILURE SEQUENCE
a. Reasons for 1998 Slope Movement
b. Hydrologic Conditions Promoting Failure
9. REFERENCES CITED
10. SELECTED FIGURES
1. Site Map Niles 7.5' 1980 (Figure 1)
2. USGS Topographic Map Mission Peak 1911 (Figure 2)
3. USGS Topographic Map Mission Peak 1943 (Figure 3)
4. Geologic map by Clarence Hall, Jr., Mission Peak 1958 (Figure 4)
5. USGS Geologic map, Mission Peak 1978 (Figure 8)
6. USGS Geologic map 1980 Dibblee
7. 1994 Graymer, Jones and Helley Cross Section AA' (Figure 16)
8. 1998 Cross Section (Figure 17)
9. 4X Vertical Exaggeration Cross Section (Figure 19)
10. Plug of Briones Sandstone being ramped upward (Figure 20-A)
a. Large block slide complexes
b. High uplift rate
11. Evolution of underlying structure (Figure 20-B)
a. 10 - 35%
b. 47 - 58%
c. 64%- Structure as it appears today
12. Channel profile (Figure 21)
13. Series of cross sections
a. 1 - 8
b. 9- 14
c. Detail of 14
14. Landslide Basal Rupture Surfaces (Plate 1)
15. Cross section X-X'
11. SELECTED PHOTOS
1. Mission Peak Landslide Overview
2. Contact between Orinda FM and Briones SS
3. Rockfall Sequence
The Mission Peak Landslide of March 22, 1998 represents the partial reactivation of an enormous bedrock landslide complex that has developed beneath Mission Ridge over a period of tens of thousands of years. This complex extends from just below the ridge crest, down to the approximate position of Mission Boulevard. The active slide occupies an area of approximately 85-1/2 acres, as shown in Plate 1. The slide extends upslope from the channel of Aliso Creek near elevation 520 (opposite Rutherford Court) to the crest of Mission Ridge, at elevation 1860, dropping 1,340 feet over a flow distance of approximately 5,450 feet1; .
We were retained by the City of Fremont to make a preliminary evaluation of the landslide sufficient to guide the city in emergency response and future planning decisions. This work entailed an evaluation of the areal extent of the landsliding, monitoring movement, engineering analyses, preparing landslide hazard maps of the area to aid the City in planning and emergency response decisions, and the development of emergency mitigation measures that might be undertaken by the City. In this guidebook we often refer to additional figures and oversize maps that were part of the consulting reports issued to the City. These consists of: Volume 1 - an Executive Summary (16 pages, 6 figures and 4 oversize plates); Volume 2 - a Technical Data Report (61 pages, 36 figures, and the same 4 oversize plates); and Volume 3 - is the Technical Data Appendices, containing 85 pages of supporting information, including boring logs, lab testing, inclinometer records, rainfall data, Mission fault figures, rock mechanics analyses, Aliso Creek hydrology, and the Aliso Creek emergency channel stabilization design.
Copies of these reports are available from Peninsula Blueprint, 41900 Fremont Blvd., in Fremont, phone (510) 490-7411. Any of the 3 volumes can be purchased, and the oversize planning maps are contained in both Volumes 1 and 2. The cost of the 3 volume set is about $90. We also intend to reproduce this guidebook with electronically scanned figures with higher resolution (many in color) and provide this on a CD-ROM. Please contact J. David Rogers for these documents. The maps have been posted on the City's web site at: http://www.ci.fremont.ca.us/citysvcs/development/engineering/missionpeakslide-a.html
SITE CONDITIONS (To Top of Page)
Topography
Between elevations 520 and 645 the toe of the landslide is bound along its lower east and south margins by the historic channel of Canada del Aliso Creek (see Plate 1). Between elevations 520 and 555 the channel was pushed about 9 feet south of its pre-slide position. Near elevation 555, the landslide moved about 16-1/2 feet westerly, constricting the channel and creating a narrow chasm, just a few feet wide. Above this position the channel was uplifted about 6-1/2 feet, then infilled with another 3 to 6-1/2 feet of sediment, lifting the channels as much as 13 feet between elevations 630 and 650, adjacent to the Mei Residence at the end of Grapevine Terrace.
Assessment of stereopair aerial photographs dating to 1939 revealed that the site has been under almost continuous use for open grazing during that interim. Several unimproved access roads and small stock ponds were graded by local ranchers between the late 1930s and mid-1950s, but none of these had any impact on recent sliding. The 1980 photos suggested settlement of the headscarp above an adjacent landslide complex, north of the 1998 slide (above Alameda County Water District's Mayhew Reservoir). The 1984 and 1986 photos revealed two large earthflows had begun to mobilize just below the upper ranch road, near elevation 1300 feet. These dropped between 6 and 10 feet, then remained dormant until March 1998. The reactivation of these earthflows between elevations 1300 and 1000 feet appear to "triggered" the 1998 movement sequence, as discussed in the conclusions.
A prominent strike-controlled bench exists across the 1998 slide area, between elevations 1200 and 1400 feet. This linear feature appears to be an old landslide headscarp graben, extending from the Ohlone Trail (near elevation 925) and natural saddle about 800 feet southeast of the slide (near elevation 1555). This depression appears to be filled with coarse detritus which promotes infiltration.
Seismicity
The subject landslide lies in the heart of a tectonically active area, which is typified by fault-bordered blocks caught between the Hayward and Calaveras faults. Hall (1958) was the first to recognize and name the Mission fault, cutting across the base of Mission Peak and Mission Ridge, towards old Mission San Jose (Fig. 1). Historic records kept by the Mission noted damaging earthquakes in 1812, 1822 and 1868 (History of Washington Township, 1965). The October 21, 1868 Hayward quake completely destroyed the mission, which was not rebuilt until the early 1980s.
Mission Fault
In 1958 Dr. Clarence A. Hall, Jr. published a synopsis of his doctoral dissertation at Stanford University (Hall, 1956) titled "Geology and Paleontology of the Pleasanton Area. Alameda and Contra Costa Counties, CA" in the University of California's Publications in Geological Sciences (v. 34:1, 89 p.). Hall was the first to recognize the Mission fault, a prominent boundary between the Briones sandstone exposed on Mission Peak and Mission Ridge, and the younger Pliocene-age non marine sedimentary rocks tightly folded in the overturned Tularcitos Syncline2; , intermittently exposed beneath the more gently inclined slope. The Orinda beds are younger and less competent non marine sedimentary units, occupying a tightly folded prism extending southeasterly, from Mission San Jose. The Orinda age equivalency was recognized as early as 1939, when they were described in John Harding's master's thesis at U.C. Berkeley (Geology of the Southern Part of the Pleasanton Quadrangle) in 1940.
Ellsworth, Olson, Shijo and Marks (1982) were among the first researchers to recognize the subsurface zone connecting the Hayward and Calaveras faults, through assessment of historic microseismicity, collected between 1969-80. They reasoned that this narrow zone of seismicity coincided with the Mission fault of Hall (1958), despite Herd's (1982) lack of physical evidence for the fault's existence, as deduced from the efforts of Woodward-Clyde-Sherrard Associates (1968) to search for the fault in the area surrounding Ohlone College. Ellsworth, et al (1982) went onto opine that focal mechanism solutions for the Mission fault indicated right-lateral slip on the seismically-defined fault plane, with one quake registering considerable thrust component.
By 1992, most Bay Area seismologists conceded that the Mission fault was part of what appeared to be a step-over feature between the Calaveras and Hayward faults that was demonstrating seismogenic creep (Oppenheimer and MacGregor-Scott, 1992; Oppenheimer and Wong and Kline, 1992; Wong and Hemphill-Haley, 1992; Andrews, Oppenheimer and Lienkaemper, 1992). By this juncture, 22 years of microseismic data had been collected, suggesting that the Mission fault was near-vertical at depth, where the quakes were occurring, with a strong right-lateral focal component. Oppenheimer, Wong and Klein (1992) noted an "absence of seismicity between the juncture of the Hayward and Mission faults and the seismicity at the southernmost end of the Hayward fault is consistent with a locked segment, and evidence of Holocene strike-slip activity on the southernmost Hayward fault is documented by Bryant (1982). While direct evidence of recent faulting along the southern Hayward fault south of Agua Caliente Creek is difficult to detect due to landslides, cultural modification, and rapid erosion, its absence does not preclude the possibility of subsurface rupture."
In the same 1992 volume, Ivan Wong and Mark Hemphill-Haley (1992) devoted an entire article to the subject of the Mission fault and its likely relationship with the Hayward fault. They describe the approximately 500 microearthquakes recorded along the Mission trace between 1969-89, calculating that south of Mission San Jose, these events were focused at depths between 3 to 7 km, describing a near-vertical fault surface between 4 and 5 km long. Focal mechanisms were consistent with a right-lateral, strike-slip fault. They add that:"Extending another 5-6 km towards Calaveras Reservoir, the microseismicity broadens into a 2-4 km wide diffuse zone also confined to depths of 3-7 km." The largest earthquake recorded along the Mission fault between 1969-91 was a ML 3.0 event. Nevertheless, Wong and Hemphill-Haley concluded this recorded seismicity "represents a transfer of slip from the Hayward fault to the Calaveras fault", as suggested by others.
Andrews, Oppenheimer and Lienkaemper (1992) described a lengthy investigation into the Mission fault, which suggested a M 6.1 earthquake may have occurred on the Hayward fault in 1858, as well as three M 5.3 to 5.7 events between 1861 and 1864; around the wedge of the Hayward fault and the northern segment of the Calaveras fault. These were precursory to the much-publicized M 6.8 Hayward earthquake of October 21, 1868, which destroyed Mission San Jose. Also of interest was these author's belief that dip-slip movement may be occurring along buried faults within the Mission fault step-over region. From a reconnaissance of the Monument Peak area they deduced that a buried thrust or reverse fault underlies the area, dipping northeasterly. The prominent scarp below Mission Peak has this same strike and sense of slip. They concluded that the Mission fault zone must consist of two or more fault surfaces inclined at different dip angles, as observed in the San Andreas fault zone in the Loma Prieta area. They reasoned that "horizontal slip is building up stress on the inclined fault, which is currently locked. Growing compressive stress will increasingly impede horizontal slip until a thrust or reverse-slip event occurs, allowing then more horizontal slip to be transferred from the Calaveras to the Hayward fault. The dip-slip fault might be the unstable element governing slip in the larger system." Despite microseismicity suggestive of activity, no one has been able to excavate the Mission fault sufficiently to allow for a good look at its surface expression, or provide for meaningful pedogenic dating of displaced soils. As a consequence, the Mission fault has not been zoned active by the California Division of Mines & Geology under the Alquist-Priolo Earthquake Fault Zoning Act3;, even though its existence is widely accepted.
Warm Springs Fault
According to Mission San Jose Mission, the warm springs along Agua Caliente Creek predate the Spanish occupation, as the friars were shown the springs by local Ohlone Indians around 1797, when the mission was founded. The springs were part of the 9,564 acre Agua Caliente land grant given to Fulgencio Higuera in 1836 and 1839, during the Mexican period. The Warm Springs Hotel was established at the springs in 1853 by Clement Columbet. According to one account by Josiah Stanford, the springs were said to issue forth up to 60,000 gallons per day of warm water (letter to Mrs. James Whipple of Niles in 1920, cited in History of Washington Township, 1965). The immediate area was cultivated for grain beginning around 1846, which was shipped to San Francisco throughout the 1850s. Beginning in 1870 the area was planted with grapes, which became the Stanford and Millard vineyards. During the 1870s the springs were rumored to have become tepid and choked with minerals.
The Warm Springs fault appears on the CDMG San Jose 1:250,000 scale (State Geology Map) sheet published in 1966. That sheet gives credit for the mapping of these faults to Professor R.L. Rose of San Jose State College. Tom Dibblee (1972) mapped the Warm Springs fault as part of the Milpitas Quadrangle geologic map released in 1972, followed by the Niles Quadrangle geologic map in 1980. Evidence for the fault was taken from lateral and vertical offsets observed in the area streams (including Agua Caliente and Aliso Creek) and groundwater level offsets noted in local wells.
These observations were apparently confirmed by JHA Consultants in 1987, when they were providing geotechnical consultations for the Vineyard Heights- Phase II subdivision. JHA trenched the supposed trace and reported evidence of surface fault rupture across the channels bordering either side of the subdivision area (in Aliso Creek and the unnamed creek just south of Grapevine Terrace. JHA (1987) recommended structural setbacks across Grapevine Terrace at Rutherford, and within the Rutherford Place cul-de-sac, showing the fault crossing Aliso Creek between elevation 590 and 597. They also mapped a thrust feature west of this trace, through what is now Grapevine Court. Their trace is shown on Plate 1.
Unnamed Fault
JHA (1987) and Crane (1988) also mapped another unnamed fault, uphill and parallel to, the Warm Springs fault, which appears to approximate the stratigraphic contact between the older Briones sandstone and the overlying Orinda formation, along the southwestern limb of Crittenden"s Tularcitos Syncline. This was shown by JHA (1987) to be 500 to 600 feet upslope of Warm Springs, striking about N 20o E, and projecting near elevation 700 upslope of the ACWD Grapevine Terrace water tank. Crane (1988) shows this fault in approximately the same location, and identifies the bedrock material between this and the Warm Springs fault as "Tmss", or Briones sandstone.
Our field reconnaissance uncovered a fault contact feature between the Briones and Orinda beds near elevation 680 feet above the ACWD Grapevine Terrace water tank. This fault was striking N 60o W, dipping 17o southeast (into the slope). It is plausible that this fault coincides with the contact between the Briones sandstone and Orinda formation beds along the Tularcitos Syncline, due to strain incompatibility between the two formations, when subjected to enormous tectonic compression.
Impact of Faults on 1998 Landslide
The Mission fault zone appears to control the underlying geologic structure of this site, and sets the stage for near-continuous landslippage that typifies the Mission Ridge/Mission Peak area. These factors include: 1) Ongoing crustal compression in this block of hills between the south Hayward and north Calaveras faults; 2) This compression appears to have fostered a high rate of uplift of Mission Ridge, likely between " and 3 mm/year; 3) The underlying strata have been conspicuously deformed such that the massive Briones sandstone comprising Mission Ridge has been turned upside-down, as compared to how it was originally deposited; 4) Underlying Orinda formation materials have been tightly folded in the overturned Tularcitos Syncline structure, which has significantly deformed the original fabric of the strata, lessening its competency; 5) The faults also serve as local groundwater barriers, which cause water pressures to build up along the uphill side of these features, and channel seepage along these zones; 6) Ongoing uplift along the Mission fault appears to be lifting the headscarp graben-controlled valley, and thereby, steepening the underlying landslide slip surfaces; and 7) The high seismicity associated with the Mission fault zone has likely served to exacerbate rockfalls, which then load the head of the landslide. Seismic shaking may also have played a role in reactivating portions of the landslide complex. The areal distribution of the massive landslides at this site appears intimately tied to the underlying geologic structure, which is extremely complex.
GEOLOGIC CONDITIONS (To Top of Page)Structural Geology and Underlying Bedrock Units
Several maps of the Niles Quadrangle were reviewed to assist in understanding the general geologic conditions that have shaped the Mission Ridge area above Hunter Lane. The bedrock geology maps and fault maps all portray the area to be under cover of an extensive Pleistocene-age coalescing landslide complex, covering the Mission and Warm Springs faults, which are thought to converge near Mission San Jose. Individual landslides were not indicated on these products.
Dibblee (1980) showed the Mission fault lying near the base of the Mission Ridge escarpment, crossing beneath the slide complex, which he indicates extends for over a mile, between Aliso Creek and Ohlone College. He also shows the Warm Springs fault concealed beneath this same complex, near elevation 600. Dibblee (1980) mapped Mission Ridge as overturned "Tmss", or Tertiary Miocene-age marine sandstone (Briones Sandstone) ; while the area between the Mission and Warm Springs faults was shown as "Tps", for Tertiary Pliocene-age nonmarine sedimentary rocks (the Orinda formation of Hall,1956, 1958). The Tps materials were folded into the Tularcitos Syncline, whose axial plane Hall projected to be dipping about 55 degrees northeast (Hall, 1956, p. 163). Dibblee (1980) projected the syncline through the upper slide area, near elevation 1200 feet. Hall (1956, 1958), Dibblee (1980) and Crane (1988) interpreted the Briones sandstone comprising the Mission Ridge escarpment to be overturned, within the northeastern limb of the Tularcitos Syncline. The overturning of the syncline, in of itself, places older strata above younger, with both units being upslope of the synclinal axis.
However, Hall (1956, 1958) and Dibblee (1980) present the boundary between these two units as the concealed Mission fault. The geomorphic evidence for faulting is graphic, but the contrast in hardness is just as pronounced. Hall (1958) indicated that the Cierbo sandstone and lenses of the Neroly sandstone may lie between the Briones and Orinda beds, in near-conformability; but he believed them missing in this location. Our trenching of the 1998 landslide headscarp suggests that a thin wedge of green Cierbo sandstone may exist in conformable (but overturned) sequence between the Orinda and Briones beds across the slide area. This bed appears to be about 25 feet thick, and is laced with thin bedding plane shears dipping approximately 25o northeast, into the slope (shown in the enlarged photos presented on foam core boards during the field trip).
Crane (1988) expanded somewhat upon Dibblee"s earlier work, inserting blind thrusts, backthrusts and overturned syncline and anticline axes, utilizing concepts of balanced structural cross sections not available to Dibblee in the 1960s and 70s. Crane mapped the same slide complex as Dibblee north of Aliso Creek, with the Warm Springs fault shown concealed beneath the slide. Like Hall and Dibblee, he also suggests that the Briones sandstone (Tmss) lies beneath the Orinda beds (Tps), between the Warm Springs fault (elevation 580) and elevation 700, along Aliso Creek. He then shows the Orinda formation above this area to be tightly folded, into the overturned Tularcitos Syncline, with an overturned anticline a short distance downslope. Crane also shows the Briones sandstone within Mission Ridge to be overturned, with the Mission fault striking northwesterly, about 100 to 300 feet downslope of the ridge escarpment.
Graymer, Jones, Brabb and Helley"s 1994 geologic map was built upon Russ Graymer"s doctoral research at U.C. Berkeley with Davey Jones. They reinterpreted much of the outcrop pattern mapped by previous workers in the Niles Canyon area, using new fossil data, terrace age data and fault relationships, including recognition of several dozen thrust faults pervading the hills east of the Hayward fault. Their cross section A-A" just catches the upper southeast headscarp of the subject slide, along a trend of N 28o E. It is reproduced herein as Figure 2.
Graymer, et al (1994) interpreted the Briones sandstone of Mission Ridge to be right-side-up, instead of upside down. They also show the Mission fault as being comprised of two steeply-dipping splays, which bound either side of Mission Ridge, lifting the Briones sandstone more than 1,500 feet. A compressional environment is suggested by this arrangement. They projected the Mission and Warm Springs faults beneath Dibblee"s massive coalescing landslide complex, bound by Aliso Creek. Their trace of the Mission fault was about 1,000 feet downslope of Mission Ridge, somewhat downhill of the trace proposed by previous workers (Fig. 2).
Preliminary Conclusions Regarding Geologic Structure
The geologic setting of the landslide area is complex, but appears to be dominated by active thrust faults with increasing sense of strike-slip motion, preceding towards the Hayward fault. During our field work we noted what appeared to be overturned crossbeds in outcrops of the Briones sandstone exposed on Mission Ridge, suggesting Hall, Dibblee and Crane were correct in this supposition. The nature of the contact between the marine Briones sandstone and the younger nonmarine Orinda formation appears conformable, as a gradational contact. This suggests that the prominent break-in-slope at the base of Mission Ridge is stratigraphically controlled, and not fault-bordered, as previous workers had assumed.
The rate of uplift along the eastern and western splays of the Mission fault is likely considerable, probably in the range of 0.5 to 3 mm /year. The overturned Briones sandstone appears to be a resistant "plug" of material that is being squeezed upward, between two reverse faults. As this resistant mass is squeezed upward, it provides an ample supply of rock available to "ramp" onto the enormous slide mass lying along the base of Mission Ridge. Our estimate of the underlying structure, based upon mapping of new exposures in the slide"s head scarp, is sketched in Fig. 3.
Seismicity recorded along the Mission fault between 1969-91 suggests vertically-inclined strike-slip motion, below 3 km depth. But this dip likely lessens with shallowing depth, approaching the ground surface, due to erasure of vertical confinement and creep induced by the topography. The observed dip of the lower Orinda beds, near their contact with the Briones/Cierbo beds (near elevation 1400 feet), appears to be about 25o NE. The nonmarine Orinda beds are clearly exposed in much of the main scarp (between elevations 1475 and 1375) and secondary scarp (between elevations 1275 and 1050). The dip of the Orinda beds is also likely influenced by gravitational creep, due to their position and low competence (soft nature). The dip of these strata likely increases with depth, as observed in the stiffer Briones beds, several hundred feet upslope. The Orinda beds appear to be tightly confined, likely within the overturned syncline proposed by Hall (1958).
The entire slope between Hunter Lane and Mission [Peak] Ridge appears to be blanketed with Pleistocene (older than 11,000 years before present) and Holocene (less than 11,000 y.b.p.) age landslides, comprised of Briones sandstone and weathered Orinda formation materials. Displaced pieces of weathered Briones Sandstone form many of the resistant knobs that typify the area, but so do conglomerate lenses belonging to the Orinda formation. Many of the displaced blocks of the Briones exhibit distinctive shell-rich beds 4 observed in outcrop on the main ridge. These blocks appear to have been brought downslope in retrogressive slides, one upon another, sliding on fault gouge and weathered Orinda sediments, as presented schematically in Figs. 18 and 19.
The thrust feature mapped by JHA Geotechnical (1987) across Grapevine Court (Plate 1) may well be toe thrust features of deep-seated ancient slope movements, as they suggested. Given the relative age of sliding in this area and the compressional tectonic environment, such explanation seems logical. Very little original structure can be deduced from outcrops in the lower slopes, where abundant fragments of Briones sandstone abound, within a matrix of clayey slide debris. The lower outcrop of Briones sandstone suggested by Hall (1956, 1958), Dibblee (1980) and Crane (1988) needs to be verified by more detailed field work. We were only able to locate what appeared to be intact Briones sandstone in two locations along the lower slope: near elevation 680 feet above the ACWD Grapevine Terrace water tank, and near elevation 800 along this same watercourse, higher upslope. Efforts to locate the surface trace of the west Mission fault, near the location shown by Hall (1958) and most subsequent workers, proved futile. Considerable microseismic and geomorphic evidence suggests that the Mission fault exists. This includes the strong linear expression of a strike-controlled depression between Ohlone Trail (elevation 925) and the ridge valley south of Mission Peak (which extends up to elevation 2300 feet). This depression appears to be a massive landslide headscarp graben between elevation 925 and 1555, crossing the subject slide between 1350 and 1450 (Plate 1). There is considerable geomorphic evidence5 which also suggests that the Mission fault splits along either side of Mission Ridge, as hypothesized by Oppenheimer, et al (1992), and shown by Crane (1988) and Graymer, et al (1994). This bifurcation could create a situation wherein the more resistant "plug" of Briones sandstone would be squeezed upward to relieve compressive pressure, as hypothesized in Figs. 4 and 5.
Our estimate of the underlying geologic structure in vicinity of the subject landslide is presented in Fig. 3. Based on the available data, we believe that the west trace of the Mission fault lies somewhat downslope of the base of Mission Ridge, as suggested by Graymer, Jones, Brabb and Helley (1994). Ongoing uplift along the fault may be assisting in "lifting" the upslope side of the prominent landslide graben block, accounting for the apparent change-in-dip of the basal landslide slip surface, as sketched in Fig. 6. This deformation would also aid in breaking up the slide blocks and assisting in their translation downslope, as suggested by the steep subsidiary slip faces observed below elevation 1300 in the 1998 slide.
If the physical situation is similar to those conditions described in Figs. 3 and 4, this would account for the seeming elusiveness of the [west] Mission fault, caught within the chaotic infill of a major landslide headscarp graben.
To date, little attempt has been made to explore the surface trace of the "east Mission fault". Landslide blocks on the northeast-facing slopes of Mission Ridge are almost as impressive as those on the southwest side, except that the total slope height is less. But, the slide blocks appear enormous, suggestive of translational features slipping on inclined bedding planes east of the ridge crest. None of these slides exhibits evidence of recent movement. The heads of some of these large slides were shown on the area-wide landslide map we prepared for the City of Fremont (Map 2, discussed later).
HYDROLOGY (To Top of Page)
Rainfall Patterns
The mean annual precipitation for the area between 1867 and present has been between 18 and 22 inches, from base to crest-of-slope. The mean annual rainfall is recognized to increase from about 15 inches in the middle of the Santa Clara Valley (San Jose) to above 31 inches at Mt. Hamilton (at elevation 4211). The crest of Mission Ridge lies at 1864 feet, increasing to 2517 feet at Mission Peak, about " mile southeast. The actual rainfall felt on the ridge is likely 20 to 25% greater than that reported by the ACWD gages, which are located in the low areas at the base of slope. During the 1997-98, 27.4 inches were recorded by ACWD"s Gage 1942 on Agua Caliente Creek, 7/10 mile south of the slide. This value was about 150% of the average annual rainfall. ACWD"s gage 50 (near the mouth of Niles Canyon) has been recording since 1870 and is located about 5 miles northwest of the slide. This gage recorded 35.2 inches of rain during the 1997-98 storm season, the second greatest total ever recorded. The two, three, four, five, six and seven year running sums of rainfall in the 1990s have been the highest cumulative totals ever recorded at Niles (since 1870), coming on the heels of the most severe drought ever recorded, between 1986-93. These data suggest cumulative rainfall likely precipitated the March 1998 landslide.
Runoff Hydrology
The pre-1998 slide area was once drained by three different streams, Aliso Creek, the next adjacent stream to the north (which fed onto what is now Hunter Highlands); and a third watercourse which ran down the landslide graben-controlled valley, towards Ohlone College. The watershed of Aliso Creek above elevation 640 appears to have enlarged from 48 to as much as 125 acres due to the 1998 slide pirating the upper reaches of the two adjacent streams. The expected range in flow along Aliso Creek near elevation 640 was estimated to be in the range of 31 to 42 cubic feet per second (cfs) for a 2.5-year recurrence frequency storm, and between 57-74 cfs for a 10-year recurrence frequency storm.
1998 MISSION PEAK LANDSLIDE (To Top of Page)
The areal limits of landslippage for the March 1998 landslide are presented in Plate 1. The slide is approximately a mile long, 800 to 1400 feet across, and measures just over 1300 feet elevation differential between crest and base. A map of the slide"s salient physical features is presented in Plate 1.
Evidence of Historic Seismically-induced Movement
The slide area above 750 feet elevation exhibited ample geomorphic expression of relatively recent landslippage in aerial photos taken between 1939-96. An active erosional scar had been developing above the slide"s head scarp since the earliest images, causing Radbruch (1972) and Herd (1979) to presume that this was the scene of seismically-induced ground fissures described by Andrew Lawson (1908), thought to be associated with the M6.8 October 21, 1868 Hayward earthquake:
"Immediately to the east of Mission San Jose, entirely within the hills, another crack opened with a strike of N. 18o to 20o W., which, converging upon the crack thus far traced, extended south as far as the County line".
Radbruch (1974) attempted to tie this description to a NW-trending lineament
cutting across the subject landslide around elevation 800 feet. There
is little confidence in this position, which appears approximate at best.
The Warm Springs fault is the closest structure which approximates the trend
and described area, but was not recognized until the early 1960s.
JHA Consultants (1987) felt they located this feature cutting across the Vineyard
Heights subdivision (depicted in Plate 1). An alternative possibility
for the "1868 ground fissure" would have been dynamic consolidation of loose
graben infill, up within the landslide graben-controlled valley, near the current
headscarp. But, this feature trends approximately N 40o W, and is
situated at considerable altitude above the old Mission District. Co-seismic
movement (strain energy release) along the Warm Springs fault or the toe thrusts
associated with the large ancient slides are the most likely culprits for the
1868 ground break.
Wahrhaftig (1978) opined that the prominent ground cracks noted in 1868 could be the tensile scarps noted in vicinity of the landslide headscarp, between elevations 1700 and 1830, which are noticeable in all historic aerial photos, predating the earliest in 1939. Extension of these scarps had not occurred this Century, prior to this year"s slide. Given the remoteness and inaccessibility of these cracks, this may be unlikely. The road serving the old McClure Ranch below Mission Peak was accessed from upper Mill Creek, along the opposite side of Mission Ridge. This is the same road that still provides access to Mission Peak Regional Preserve from the north.
We conclude, therefore, that it is unlikely any reliable correlation can be drawn between the 1868 ground fissures and the subject slide, absent further information. Based on the related description, we would suspect that these cracks were associated with co-seismic stress relief along the Warm Springs fault, or dynamic consolidation of the linear headscarp graben infill materials.
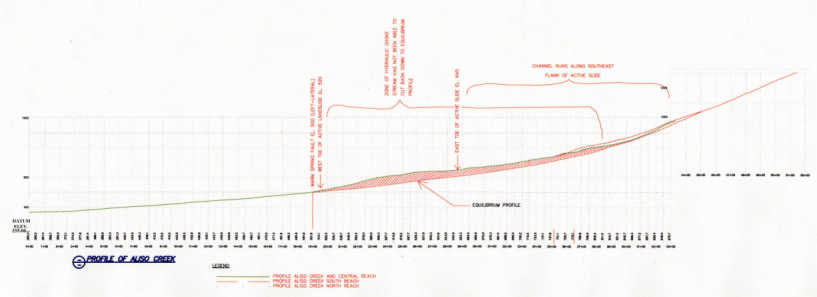
Perturbed Channel Profile
The most powerful suggestion for geologically-recent landslippage is the perturbed profile of Aliso Creek, presented in Fig.7. This profile suggests Aliso Creek is out-of-equilibrium with respect to its hydraulic grade, between elevations 500 about 810 feet, due to massive choking of the channel by landslide debris. More debris has been produced than the channel has adequate stream power to remove, resulting in a profile with upward concavity. A channel with normal balance between runoff and sediment yield (in "equilibrium") will tend to develop a decreasing profile with increasing watershed area, accumulated downstream (Schuster, 1997; Rogers, 1997).
Field evidence for hydraulic choking is also abundant, between elevation 500 and 520, where the channel gradient increases sharply, in a series of small drops. Part of this change may be associated with vertical offset of the Warm Springs fault, which supposedly crosses Aliso Creek between elevation 500 and 505. But, faulting cannot, of itself, account for the convex form of the channel profile between elevations 500 and 650, which is suggestive of a large sediment "plug".
Recent Channel Offsets
JHA Associates (1987) noted that Aliso Creek and the unnamed creek channels bordering the south side of the Vineyard Heights subdivision exhibited sharp drops in their channel profiles, which ranged between 8 and 10 vertical feet. These drops appear coincident with the projected trace of the left-lateral Warm Springs fault, discussed previously.
During the week of March 22-29, 1998, the channel of Aliso Creek appears to have been pushed about 9 feet southerly, between elevations 520 and 550, where the "Hammertime" block has been forced against the opposing (south) creek bank.
Near elevation 550 the landslide toe translated approximately 16-1/2 feet southwesterly, into the channel of Aliso Creek, creating a hydraulic choke. This block was over 100 feet high, and translated approximately 6-1/2 feet upward and 11-1/2 feet laterally, with a upward rake of approximately 30o (rake dipping northeast) The recurrence of this blockage through recent geologic time (past several hundred to several thousand years) also suggests geologically-recent activity of the 1998 landslide complex. Given the sharpness of channel perturbations, it would appear that the slide has only been dormant 200 to 600 years since its last episode of movement, which was likely of similar magnitude to that observed this year.
Geometry of the 1998 Landslide Complex
In order to estimate the likely depths of landslippage and volume of slide mass, 16 longitudinal and four transverse geologic cross sections were constructed across the 1998 landslide area and adjacent ground. The locations of these cross sections were shown in Fig. 22 of Vol. 2 of the reports submitted to the City of Fremont. These cross sections utilize subsurface data, surface measurements and published physical relationships reported by others who have studied similar landslides, and principles of block kinematics. The purpose of reconstructing balanced cross sections was to estimate the likely depths of sliding, and delineate those blocks of ground involved in the recent movements. A representative sample of these cross sections is presented in Fig. 8.
Three principal cross sections taken through the headscarp area (Section H-H is presented in Fig. 8) present our estimate of the underlying conditions in the headscarp area of the 1998 slide, where the block movements appear deepest. These cross sections suggest an initial headscarp graben width of approximately 400 feet, which extends downward between 110 and 180 feet. As the upper translated downslope, an extensive graben, or pull-apart structure, was thereby formed. Grabens collect surface runoff and talus from the newly-evacuated headscarp. As this headscarp depression infills with eroded material and water, the graben periodically extends itself, allowing the graben block to back-rotate and break into smaller pieces. The pull-apart graben would typically support sag ponds like those observed this past year near elevation 1280. Within a few years the ponds begin to fill with sediment and coarse talus shed from the eroding headscarp. In this manner, grabens gradually become filled with fine grained pond sediment and coarse talus, often including house-size boulders. This mixture was observed across the headscarp depression area following this year"s movements.
About 60,000 cubic yards of coarse sandstone talus appears to have fallen onto the headscarp graben this past summer, due to retrogression of the headscarp within Mission Ridge. The reasons for this regression are not fully understood, but appear related to the geometry of the overturned Briones beds, their joint patterns, and the close proximity of low-strength Orinda beds, which exhibit evidence of shearing inclined clay seams, in "toe kick-out". In this manner, enormous wedges of Briones sandstone are "brought down", which increases the load on the landslide, which leads to more movement, and so on. Geomorphic evidence of rapid slippage, landslide movement and headscarp erosion are abundant within the 1998 slide area. This situation does not appear so acute at other locations along Mission Ridge, suggesting this as the most likely location for periodic landslide activity.
As the landslide becomes increasingly loaded with rock talus and absorbs runoff, the slide mass should periodically reactivate above elevation 1300. It would appear that this block has moved about 400 to 650 feet or more from its original position, as the entire exposed face (between elevations 1125 and 1275) appears comprised of Orinda formation materials. Additional movements are also fostered by percolation of water into the headscarp sag ponds (near elevation 1280 at the present time). The entirety of the "Titanic" block, between elevations 925 and 1215, appears to be comprised of displaced Orinda beds, devoid of recognizable structure. This is indicative of a much older sequence of translational slippage, lying at some unknown depth.
Below elevation 1125 on the north side of the Titanic block, and elevation 1150 on the south, are a series of deep-seated earth flows which mobilized this past March. Those on the north side extend down to elevations 700 to 775, while those on the south side are much smaller, and only extend to elevation 855. Cross Sections H-H" (Fig. 8) and L-L" (Fig. 25 in Vol 2 of the City report) suggest that the northern earthflows could extend to depths of 70 to 100 feet, but this has not been confirmed. However, based on the 35 feet height of the lateral scarp along the north side of the "Titanic" block, these estimates appear reasonable. The massive earthflows along the north side of the middle slope area begin to thrust upward around elevation 875, and continue in a series of toe thrust "steps", down to elevation 700. Some of these toe thrusts appear to have lifted as much as 110 feet, as suggested in Cross Sections A-A" and B-B" (Fig. 27 of Vol. 2 of the City report).
Below elevation 775 feet, a series of ancient landslide blocks appear to have been loaded by these recent toe thrusts, and have reacted in passive compression, along pre-existing slip surfaces (associated with past landslippage). Representative samples of these blocks are presented in Fig. 8 and Figs. 27 and 28 of Vol. 2 of the City report. In this lower slope of the 1998 slide, we observed considerable evidence of compression, including multiple toe thrusts and back-thrusts, as shown on Plate 1 and Fig. 8.
A peculiar aspect of the slide"s toe is the thrusting which occurred adjacent to the Mei Residence at 2978 Grapevine Terrace. In this area the landslide made a sudden 70 degree right-hand turn, about 50 feet northeast of their home, along a pre-existing plane of weakness, akin to a fault (see annotation "abrupt toe thrust" on Fig. 8). Past landslippage appears to have occurred along this boundary, sufficient to have elevated a toe-thrusted hillock over 85 feet high6 overlooking Aliso Creek. This low strength boundary may be the lateral scarp of a much older landslide block, or a transverse fault.
Recent movement at the slide toe appears to have been close to 5 meters, the majority of which occurred between March 22-29, 1998. Components of this movement were both vertical (6.6 feet, or 2 meters) and horizontal (11.5 feet, or 3.5 meters), for an upward rake (incline) of approximately 30 degrees (dipping northeast). This movement has shifted the afore-mentioned hillock 11.5 feet (3.5 m) towards Aliso Creek, killing 3 mature trees astride the channel, and constricting channel flow by creating a landslide dam. The channel of Aliso Creek above elevation 550 feet appears to have been elevated between 6.6 feet (2 m) and 8.2 feet (2.5 m) in the toe area (see footnote 6 ).
Apparent Offset of Landslide by the Underlying Mission Fault
The prominent bench developed along the landslide"s headscarp graben and the observed back-rotation of this block suggests the basal landslide slip surface flattens in vicinity of the headscarp, as shown in Figs. 6 and 8. This change appears to occur just upslope of the prominent ridge that pervades the area, between elevations 1000 and 1300 across the slide area (increasing in elevation preceding southeasterly). This prominent ridge appears to form the western side of the landslide headscarp graben-controlled valley (Plate 1). At first glance one assumes that this secondary ridge has simply pulled away from Mission Ridge, but close inspection reveals it to be comprised of Orinda beds that are pervasively sheared and exhibits sporadic structure. The resistant nature of the promontory is ascribable in part to conglomerate lenses and overlying blocks of Briones sandstone, but some of the elevation may be tectonically-induced, by ongoing uplift of the underlying Mission fault.
Our evaluation of exposed outcrops at the base of Mission Ridge (described earlier under "Mission fault studies") suggested that the Mission fault does not lie at the base of the ridge, as suggested by Hall (1956, 1958) and others who succeeded him. The sharp break in slope appears to be stratigraphically controlled, at the gradational contact between overturned sequences of the Orinda/Cierbo formation and older Briones sandstone, which is much more resistant. Graymer, Jones, Brabb and Helley (1994) suggested that the Mission fault is located about 500 to 600 feet downslope of the contact (Fig. 2), which appears to be supported by our more recent work.
In order to evaluate the potential impact of uplift along the Mission fault on the subject landslide complex, a series of 14 cross sections were drawn through the headscarp graben area (Fig. 6), and small increments of downslope translation were modeled along with even smaller increments of vertical uplift along the Mission fault, assuming its underlying position to be about 500 feet downslope of Mission Ridge. One of the interesting aspects of this model was the compressional flower structure that is suggested to develop above the fault, within the landslide. A similar "step" in the prototype landslide"s basal slip surface appears to exist, as evidenced by the marked backward rotation of the headscarp with simple translation for several hundred feet downslope, wherein the basal slip surface(s) steepen markedly, downslope of the prominent "secondary ridge" forming the southwest side of the landslide headscarp graben.
In addition, recent uplift along the Mission fault could also account for the prominent "secondary ridge", which parallels Mission Ridge, about 500 feet southwest, along the strike of the Mission fault. Although this is conjecture, based upon geometric relationships and assumed rates of offset and uplift, such a model does appear to replicate the physical aspects of the field situation. If such a model were true, the ongoing movement and uplift along the Mission fault is one of the primary mechanisms reactivating the landslide, probably every few hundred or few thousand years.
IMPACT OF PREVIOUS
LANDSLIDE MAPPING ON LAND USE PLANNING (To
Top of Page)
The subject landslide was initially recognized in the published literature in the late 1950s (Hall, 1958). Between 1970-75 the Federal Department of Housing and Urban Development (HUD) sponsored a joint project with the Western Regional Office of the U.S. Geological Survey termed the "San Francisco Bay Region Environment and Resources Planning Study". Its purpose was to develop geologic hazard maps for planning purposes in the San Francisco Bay Region. This was an unprecedented undertaking, which involved compiling maps on a wide range of features, including bedrock geology, landslides, groundwater resources, hydrology, water quality, and toxicity. Of particular note, the program paid for the preparation of reconnaissance-level bedrock geology and landslide hazard maps, initially at 1:62,500 scale. These were followed upon by special bulletins dealing with landslide mapping and correlations between rainfall and historic activity, which culminated in the following documents: T.H. Nilsen, F.A. Taylor and E.E. Brabb, 1976, Recent Landslides in Alameda County, CA (1940-71): An Estimate of Economic Losses and Correlations with Slope, Rainfall, and Ancient Landslide Deposits: USGS Bulletin 1398, 21 p, 1 pl.; and T.H. Nilsen, F.A. Taylor and R.M. Dean, 1976, Natural Conditions That Control Landsliding in the San Francisco Bay Region - and Analysis Based on Data From the 1968-69 and 1972-73 Rainy Seasons: USGS Bulletin 1424, 35 p., 1 pl. The landslide maps contained in these bulletins were also released at a scale of 1:62,500, or about 1 inch = 1 mile.
The key products of the HUD program were fifty-seven 7.5-minute USGS landslide quadrangle maps by Tor Nilsen, termed "Preliminary Maps of Landslides and Surficial Soil Deposits", and released as open file reports, beginning in 1975. Nilsen"s landslide map of the Niles 7.5-minute quadrangle was released as USGS Open File Report 75-277-40 in 1975. The Nilsen map (Fig. 9) presented a more thorough appraisal of landslides in the Mission Peak and Mission Ridge area. Few consultants took the Nilsen maps seriously until the severe winters of 1981-82 and 1982-83, when an unprecedented number of older, deep-seated bedrock slides reactivated.
The area also received attention from reconnaissance-level seismic risk assessments by Radbruch (1974) and Herd (1978), who suggested the entire slope area below Mission Ridge was a ancient landslide complex; and a somewhat less inclusive area, north of Aliso Creek was inferred as massive landslide deposits by Dibblee; Crane and Graymer, et al (1994). An overlay of the landslide areas mapped by Hall, Nilsen, Herd, Dibblee and Graymer, et al is presented in Fig. 10.
Fremont was one of those cities who benefited from the HUD/USGS program, having been incorporated in 1956. Fremont experienced a building boom in the 1980s which paralleled development in the Silicon Valley, bringing more than 3,000 new business to the City. As part of this boom, ranches located on the moderate slopes east of Mission Boulevard were allowed to develop. Amendments to the City"s development policy were made in 1982, 1986,1987 and 1989 (latest revision). These included limiting development on slopes steeper than 30%. The Vineyard Heights-II Subdivision was created in the mid-1980s, but not actually developed until the early 1990s, because of a slow-down in construction which occurred between 1989-94.
During the building of the 1990s, residential construction was brought uphill to Aliso Creek and halted, the Mei parcels being the uppermost units of Vineyard Heights, with the former Hammertime mansion the highest parcel of the Vista del Sol subdivision, across Aliso Creek. Given what we know at present, these subdivisions were carried just about as far upslope as appropriate, so as to avoid reactivated landslides.
Adjacent Slide Complex
Additional landslide mapping was undertaken of the area upslope of Alameda County Water District"s (ACWD) Mayhew Reservoir by Dr. Robert Wright of Harlan-Tait Associates in 1994. Dr. Wright had previous experience in regional landslide mapping with the U.S. Geological Survey in the late 1970s7 . This map was the most detailed assessment undertaken till that time, covering the slope area between Ohlone College and Aliso Creek (Wright"s 1994 map was reproduced as Fig. 13 in Vol. 2 of the City report). Like Herd (1978), he interpreted the entire slope area below Mission Ridge to be landslides. Wright mapped the 1998 slide area as "Qls 2113"; a grading and identification scheme which equated with: "Dormant, definite landslide, slump-flow complex, more than 15 feet deep". Nilsen"s 1975 map and that of Harlan-Tait (1994) were the only products focused entirely on landslides, and thereby, exhibit much greater detail with respect to individual slides within the larger complex.
A large natural depression occupies the head of this complex near elevation 900 feet, which may aid in recharging moisture to the slide complex. Although this complex is not fed detritus or runoff directly from Mission Ridge, some manner of tensile scarp adjustment appears to have occurred along the base of Mission Ridge above this complex between early November 1980 and late February 1981, suggestive of a possible deep-seated connection. Other portions of this complex appear relatively dormant, hence the variation in grading shown on the Relative Landslide Susceptibility Map prepared for the City.
LANDSLIDE
HAZARD MAPPING UNDERTAKEN IN 1998 (To
Top of Page)
A series of four landslide hazard maps were prepared for the City of Fremont in a format similar to that used by the California Division of Mines & Geology (CDMG) for implementation of the Landslide Hazard Identification Act (Chapter 7.7, Division 2 of the California Public Resources Code). Similar products have been prepared in other parts of the S.F. Bay Region since 1976, when the State released "Geology for Planning: Central and Southeast Marin County, California", as CDMG Open File Report 76-2.
These maps included "Geologic Features of the Mission Peak Landslide" (Map 1), presented at a scale of 1" = 200', similar to the enclosed Plate 1, but without the basal slip surface isopleths. This map incorporated available published data and benefited from site visits and discussions with other geologists who've worked the area. We focused our efforts on confirming work previously reported by others, and looking for evidence of the Mission and Warm Springs faults. Although we have not conclusively identified either fault, we believe we have localized their likely whereabouts, beneath the slide complex. In this effort we were greatly aided by new exposures created by enlarging landslide headscarps, which have continued to expand since the initial failure. Arrows indicate the relative direction of movement: single arrows for earthflows and twin parallel arrows for slumps and translational blocks, moving as semi-coherent blocks. Open elongate triangles are used to describe old headscarp evacuation scarps, which may be developed upon older landslides. Thrust features are shown with solid saw teeth on the upper plate. This applies to backthrusts as well, which were common in the toe area (prior to the recent channelization work). Lateral thrusting was also observed north of the headscarp graben, and along the western margins of the of the slide"s toe. Uphill-facing tension scarps were also observed near the slide toe, and at isolated locations along the southwest-facing slope of Mission Ridge, in the Briones sandstone. Some of the more prominent cultural features, such as fire roads, stock ponds and the landslide graben-controlled valley, are also delineated on this map, in order to aid the reader in locations.
The other maps prepared for the City are not contained in this field guide because they are oversize sheets. The maps have been posted on the City's website at http://www.ci.fremont.ca.us/citysvcs/development/engineering/missionpeakslide-a.html. Map 2 was titled "Landslides and Related Features Map of the Mission Ridge Area", and was prepared at a scale of 1" = 500' on an orthophoto-derived topographic base imaged in July 1998, with contour intervals of 5 and 10 feet. It presents the results of our reconnaissance-level engineering geologic mapping of the entire Mission Peak landslide area, between Ohlone College, Mission Peak, Agua Caliente watershed and Mission Boulevard. The map delineates recent and ancient slump-block slides, recent and dormant earthflows, displaced rock wedges, selected areas believed to be underlain by colluvium, and prominent geologic discontinuities, such as faults. Hillslope areas previously subjected to mass grading for residential development were not mapped as part of this study. This includes the areas below Hunter Lane, Cougar Circle and Vineyard Avenue.
Map 3 was titled "Relative Landslide Susceptibility Map for the Mission Ridge Area", and was prepared at a scale of 1" = 500', on an orthophoto-derived topographic base imaged in July 1998, with contour intervals of 5 and 10 feet. This map was prepared to aid in general land-use planning. The mapped landslide features were divided into four categories, graded from 1 to 4 with increasing susceptibility to future landslippage. Area 1 is the least susceptible area; 2 is marginally susceptible; 3 is generally susceptible; and 4 is graded as most susceptible. This map was not intended for evaluation of individual sites, only to point out those areas worthy of further site-specific investigation should new construction be contemplated. This map is a derivative map based upon information gathered for this study on: 1) the occurrence and distribution of landslides, other types of slope failures, and features indicative of slope instability; 2) the underlying geology of the area, including bedrock types and material properties relative to slope stability and distribution of the various earth materials, as well as the structural framework, such as folding and faulting of the strata; and 3) the relative behavior of slopes within the area as interpreted from analysis of aerial photographs, topographic expression and field observations.
Map 4 was titled "Potential Debris Flow and Water-Borne Debris Deposition Zones in the Mission Ridge Area", and covers a somewhat smaller area, at a scale of 1" = 300 feet, covering all the watercourses emanating from the Mission Ridge study area, between Ohlone College and Agua Caliente. The base map is taken from the same July 1998 orthophoto imagery as the companion maps. This map presents a radical departure from the traditional CDMG Map 4 format in that it sought to highlight areas where sediment deposited by debris flows and fluvial flood flows could be expected, as well as the likely material source areas. Peer reviewers Bill Cotton, Bill Dietrich and Jonathan Stock provided significant impact on this map, which is something of a prototype hazard planning product. Three common depositional mechanisms were identified across the study area: 1) Active landslides supply disaggregated particles, which can then be transported by fluvial flow within first and second-order ephemeral channels; 2) Debris emanating from landslide dams across channels, which propagate debris flows when the dams overtop and breach; and 3) Debris emanating from rapidly-moving flow slides in steep upland slopes or active landslide faces comprised of predominately granular materials.
Abundant debris was noted to have collected within
several of the ephemeral channels surveyed across the study area, usually within
channels with more than 15% slope. Much of this debris appears related
to past episodes of debris being caught behind obstructions, such as trees,
within these channels. In this fashion, debris is "stored" in ephemeral channels
until such time when the debris is taken up in bulking and carried downstream
in a debris flow. Experience has suggested that the debris tends
to be deposited along channels with slopes between 20% and 6%, depending on
flow volume (which is related to tributary watershed area), channel shape and
roughness. In a few locations, such as Agua Caliente (Hidden Valley Creek),
old debris fan terraces were identified, which are incised by present-day channels.
Although debris flow deposits are relatively rare in this area, most of these
materials appear to have been deposited on slopes greater than 10%.
Subsequent overland flows (runoff) could sieve these deposits of their fine-sized
fraction, transporting it downstream through flood flow processes.
CONCLUSIONS REGARDING THE LIKELY FAILURE SEQUENCE (To Top of Page)
Based on these evaluations, the pre-existing topography, and the aerial photo assessment, it would appear that the 1998 landslide sequence probably initiated in the steep slope that formerly existed below elevation 1275, where tension scarps associated with partial activation of large earthflow slides were noted in the 1984 and 1986 aerial photos. These scarps were also visible in the 1995 and 1996 photos, though the slides were then dormant.
Given the available data and exposures in the slide headscarp, it appears that Mission fault lies 400 to 800 feet southwest of, and parallel to, the base of Mission Ridge. We know from microseismic data collected since 1969 that the Mission fault is an active right-lateral fault with near-vertical inclination below a depth of 3 km. Since the early 1990s there has been a consensus of opinion that the Mission fault likely represents a stress and seismicity transfer between the northern Calaveras and south Hayward faults. To date, no one has uncovered the surface trace of the Mission fault, because of massive landslides covering the interval between Mission Peak and Mission San Jose. In 1997 the State of California and the International Conference of Building Officials jointly determined that the Mission fault would henceforth be zoned as the "Hayward fault south", as an A-type fault", subject to near-field loading evaluations within 2, 5 and 10 km, discussed previously under "Seismic Slope Stability" in Vol.2 of the City report. The Hayward fault is recognized to have a slip rate of approximately 9 mm/year with a maximum moment magnitude, ML , of 7.1.
A detailed spatial analysis of the 1998 slide suggests the massive headscarp graben back-rotated as it dropped, translating southwestward on a slight incline. A prominent "secondary ridge" exist parallel to Mission Ridge, between 600 and 1000 southwest. At first glance this escarpment appears to be massive blocks of Briones sandstone, displaced by simple back-rotation from Mission Ridge, akin to giant Toreva blocks (Reiche, 1935; Strahler, 1940). But, the topographic prominence of this lower ridge/bench may also be ascribable to tectonic uplift along the Mission fault, which underlies the ridge (as depicted in Fig. 6). In either case, the secondary ridge creates an over-steepened slope between elevations 1050 and 1350 feet. The initial sliding appears to have occurred along the southwest-facing slope of the secondary ridge, as a series of retrogressive slump blocks which converted into deep-seated earthflows as they translated downslope (Plate 1). The parent materials appear to be dominated by Orinda formation materials, seen from below as a mottled series of gray, red and olive colored sediments. These earth flows extend between elevations 1275 and 700 feet.
When this mass of material moved downslope, the lateral restraint it provided for the next-adjacent blocks upslope was sufficiently diminished to allow for reactivation of these upper blocks as well, which appear to be upwards of 180 feet deep (Fig. 8). This movement allowed a similar reduction in lateral restraint for the base of Mission Ridge, which began to crumble and fall into the headscarp, beginning on May 22, 1998.
The movement of the deep upper block appears to have involved the zone between surface elevations 1275 and 1425, while the breakup of the Mission Ridge block, above the original headscarp, extended from elevation 1375 up to 1830 feet. The headscarp evacuation scar appears infilled with sandstone breccia and detritus, obscuring any underlying structure. This testifies to past movements and separations, which were subsequently infilled with coarse slope wash, in the recent geologic past.
The lowermost blocks, between elevation 700 and 520, appear to have been caught in passive reaction to the more than 100 feet of surcharge brought down by the massive earthflows on March 22nd. These lower blocks were pushed approximately 5 meters, extending beneath Aliso Creek to elevation 550, and down to Aliso Creek between elevations 550 to 520. The likely sequence of sliding is sketched schematically in Fig. 11.
There exist ample geomorphic evidence to suggest that similar movements have occurred in the recent geologic past, causing the channel profile of Aliso Creek to have become choked. A sobering aspect of the recent movement has been the observance of movement between Aliso Creek and elevation 700, within a zone of ancient landslide blocks that had appeared quite dormant, until close examination. This suggests that the "no-build", or "buffer zone" between Holocene-age slides and the homes being deemed safe for development might be extended outward, towards 1200 feet 8 , in order to allow for reactivation of older slide blocks situated below the more obvious zones
Reasons for 1998 Slope Movement
The reasons for reactivation of the Mission Peak landslide
this past winter are listed below, in relative descending importance.
In reviewing these reasons, the reader should be made aware that the prima facie
reasons for reactivation of ancient landslides lies in the fact that they preexist.
Underlying geologic conditions control WHERE slides occur, while transient hydrologic
conditions tend to control WHEN they occur. Correspondingly, the reasons
outlined below are therefore split into two categories: 1) geologic conditions;
and 2) hydrologic conditions.
Geologic Conditions Promoting Failure:
1. This year's slide occurred at the location of a pre-existing deep-seated
slide that has long obscured the underlying bedrock geology of the slope area
below Mission Ridge north of Aliso Creek and south of Ohlone College.
This area was mapped by many different geologists, including: Hall (1956, 1958);
Radbruch (1974); Nilsen (1975); Herd (1978); Dibblee (1980); Crane (1988), Graymer,
Jones, Brabb and Helley (1994) and Harlan-Tait Associates (1994).
2. There exists considerable evidence for Holocene-age movement within the subject landslide complex over the past several hundred years. The most recent movements likely occurred within the past 200 to 500 years, based on the geomorphic expression of the toe area, along Aliso Creek (Fig. 7). In addition, there are a number of back-facing tensile scarps in the Briones sandstone outcrops on Mission Ridge, which also testify to recent incipient block movements, similar to the types of separations observed this year.
3. The site is tectonically active, with a high rate of uplift that serves to lift Briones sandstone along the west Mission fault, which serves as a sort of "loading ramp", providing a never-ending supply of sandstone blocks that are available to cascade down the slopes of Mission Ridge (Fig. 4). Crustal compression between the Hayward and Calaveras faults has caused extreme folding and faulting of the intervening block of land.
4. This is an area of high seismicity. Historic seismicity along this zone has only been monitored since 1969, but has exhibited one markedly active microseismicity. To date, earthquake epicenters along the Mission fault have only been recorded and focal mechanisms confirmed at depths greater than 3 km, where the fault plane is essentially vertical.
Hydrologic Conditions Promoting Failure
5. The principal reason for this year's reactivation appears to be the unprecedented levels of moisture recorded in this area since January 1993. Two, three, four, five and six-year running sums of cumulative precipitation recorded at the nearby Niles station suggest all-time highs in cumulative rainfall over that interim, having been preceded by a 6-year all-time low in cumulative precipitation between 1986-92. This comparisons are based solely upon the Niles gage, in recordation since 1870 (presented in App. D of Vol. 3 of the City report).
REFERENCES CITED
(To Top of Page)
Andrews. D. J., Oppenheimer, D.H., and Lienkaemper, J.J., 1992, The Mission link between the Hayward and Calaveras faults: in Borcherdt and others, eds., Proceedings of the Second Conference on Earthquake Hazards in the Eastern San Francisco Bay Area: CDMG Special Publication 113, p. 217-223.
California Division of Mines & Geology, 1997, Guidelines for Evaluating and Mitigating Seismic Hazards in California: Special Publication 117, 74 p.
Crane, R.C., 1988, "Geologic Map of the Niles Quadrangle, Alameda County, California": in R.C. Crane, ed, Geology of the San Ramon Valley and Environs: Northern California Geological Society, San Ramon, 131 p., 17 pl.
Crittenden, M.D., 1951, Geology of the San Jose-Mount Hamilton Area, California: California Division of Mines Bulletin 157, 74 p.
Crozier, M.J., 1973, Techniques for the Morphometric Analysis of Landslips: Zeitschrift fur Geomorphologie, n. F, v. 17:1, p. 78-101;
Cruden, D.M., 1991, Observation of Graben geometry in landslides: in R.J. Chandler, ed., Slope Stability Engineering: Institution of Civil Engineers, Thomas Telford, London, p. 33-35).
Cruden, D.M., and Varnes, D.J., 1996, Landslide Types and Processes: in Turner, A. K., and Schuster, R.L., eds., 1996, Landslides: Investigation and Mitigation: Special Report 247, Transportation Research Board, National Research Council, National Academy Press, Washington, 673 p. .
Dibblee, T.W., 1980, "Preliminary Geologic Map of the Niles Quadrangle, Alameda County, California", U.S. Geological Survey, Open File Report 80-533C.
Ellsworth, W.L., Olson, J.A., Shijo, L.N., and Marks, S.M., 1982, Seismicity and Active Faults in the Eastern San Francisco Bay Region: in Hart, Hirshfeld and Schulz, eds., Proceedings of the Conference on Earthquake Hazards in the Eastern S.F. Bay Area: CDMG Special Publication 62, p. 83-91.
Fremont, City of, 1989, Fremont General Plan Update, Citywide Issues Evaluation Report: Hill Area: City of Fremont Planning Department, July, 76 p.
Graymer, R.W., Jones, D..L., Brabb, E.E., and Helley, E.J., 1994, "Preliminary Geologic Map of The Niles 7.5 Minute Quadrangle, Alameda County, California", U.S. Geological Survey Open File Report 94-132.
Grunsky, C.E., 1908, Rain and Run-off near San Francisco, California: Transactions of the American Society of Civil Engineers (with discussions), v. 61, p. 496-543.
Hall, C.A., Jr., 1956, The Geology of the Pleasanton Area, Alameda County, California: Ph.D. dissertation in Geology, School of Mineral Sciences, Stanford University, 269 p.
Hall, C.A., Jr., 1958, Geology and Paleontology of the Pleasanton Area, Alameda and Contra Costa Counties, CA: University of California Publications in Geological Sciences, v. 34:1, 89 p.
Harding, John W., 1940, The Geology of the Southern Part of the Pleasanton Quadrangle, CA: Master"s thesis in Geology, U.C. Berkeley, 70 p.
Helley, E.J., Lajoie, K.R., and Burke, D.B., 1972, "Geologic Map of Late Cenozoic Deposit Alameda County, California", U.S. Geological Survey Miscellaneous Field Studies Map MF-429.
Herd, D. G., 1982, Map of principal recently active faults in the San Francisco Bay Area, CA: USGS Misc Field Studies Map.
Herd, D.G., 1978, "Map of Quaternary Faulting Along The Northern Calaveras Fault Zone, Diablo; Las Trampas Ridge, Dublin, Niles, and La Costa 7.5 Minute Quadrangles, California", U.S. Geological Survey Open File Report 78-307 (5 sheets).
Hutchinson, J.N., 1983, Methods of Locating Slip Surfaces in Landslides: AEG Bulletin, v. XX:3 (August), p. 235-252.
IAEG Commission on Landslides, 1990, Suggested Nomenclature for Landslides: Bulletin of the International Association of Engineering Geology, No. 41, p. 13-16.
JHA Geotechnical Consultants, Inc, 1987, "Revised Geology and Geotechnical Engineering Feasibility Study Vineyard Heights Phase II Fremont, California", an unpublished report dated July 23, 1987, for Trilex Construction, Inc, San Jose, California.
Lawson, A.C., et al, 1908, Comparison with Other Severe Earthquakes in the Same Region. The earthquake of 1868: in The California Earthquake of April 18, 1906, Report of the State Earthquake Investigation Commission: Carnegie Institution of Washington, p. 434-436.
Lawson, A.C., 1914, The San Francisco Folio: U.S. Geological Survey Geologic Atlas No. 193.
Merritt, F.C., 1928, History of Alameda County, California: Clarke Publishing Co., Chicago, 2 volumes, 694 p.
Nilsen, T.H., 1975, "Preliminary Photointerpretation Map of Landslide and Other Surficial Deposits of The Niles 7.5 minute Quadrangle, Alameda County, California", U.S. Geological Survey Open File Report 75-277-40.
Oppenheimer, D.H., and MacGregor-Scott, N, 1992, The Seismotectonics of the Eastern San Francisco Bay Region: in Borcherdt and others, eds., Proceedings of the Second Conference on Earthquake Hazards in the Eastern San Francisco Bay Area: CDMG Special Publication 113, p. 11- 16.
Oral History Associates, 1988, City of Fremont - The First Thirty Years: Mission Peak Heritage Foundation, Interprint, San Francisco, 249 p.
Orris, G.J., and J.W. Williams, 1984, Landslide Length-Width Ratios as an Aid in Landslide Identification and Verification: AEG Bulletin, v. 21:3, p. 371-176.
Radbruch, D.H., and L. Weiler, 1963, Preliminary Report on Landslides in a Part of the Orinda Formation: USGS OFR, 34 p.
Radbruch-Hall, D.H., 1974, "Map Showing Recently Active Breaks Along The Hayward Fault Zone and The Southern Part of The Calaveras Fault Zone, California": U.S. Geological Survey Miscellaneous Investigations Map I-813..
Rantz, S.E., 1971, Precipitation Depth-Duration-Frequency Relations for the San Francisco Bay Region, California: USGS/HUD S.F. Bay Region Environment and Resources Planning Study Basic Data Contribution 25.
Reiche, P., 1937, The Toreva Block, a Distinctive Landslide Type: Journal of Geology, v. 45, p. 538-548.
Reneau, S.L., 1988, Depositional and Erosional History of Hollows: Application to Landslide Location and Frequency, Long-Term Erosion Rates, and the Effects of Climatic Change: Ph.D. dissertation, Geology, U.C. Berkeley, 327 p.
Robbins, S.L., Oliver, H.W., and Holden, K.D., 1976, "Bouguer Gravity Map of California, San Jose Sheet": California Division of Mines and Geology, Scale 1: 250,000.
Rogers, J.D., 1986, Landslide Processes of the East Bay Hills: Field Trip Guide, 29th Annual Mtg Association of Engineering Geologists, San Francisco, 90 p.
Rogers, J.D., 1997, Application of Stream Gradient Profiles to Identify Old Landslide Dams: Program with Abstracts, 40th Annual Mtg, Assn Eng"r Geologists, Portland, p.142.
Rogers/Pacific, Inc., 1985, Geotechnical/Hydrologic Review [of the] Proposed Loch Lomand - Unit 10, San Rafael, CA: consultant"s report for City of San Rafael, CA., dated Oct 28, 1985, 9 p., 2 pl.
Schuster, R. L., 1997, Landslides: Effects on the natural environment: Proceedings of Symposium on Engineering Geology and the Environment, Int"l Assn Eng"g Geology, Athens, June 23-27, 17 p.
Strahler, A.N., 1940, Landslides of the Echo and Vermillion Cliffs, Northern Arizona: Journal of Geomorphology, v. 3, p. 285-301.
Thompson & West, 1878, "Official Historical Atlas Map of Alameda County, California, Compiled, Drawn, and Published from Personal Examinations and Survey", Bicentennial Reprint-1976-Valley Publishers-Fresno.
Trask, P.D., 1922, The Briones Formation of Middle California: University of California Publications in the Geological Sciences, v. 13, p. 113-174.
Upp, R.R., 1975, Prediction of Slip-Surface Geometry from Landslide Width: MS thesis, Humboldt State Univ., Arcata, 65 p.
U.S. Geological Survey, 1911, Pleasanton 15-minute Quadrangle, California, Scale 1: 62500.
U.S. Geological Survey, 1943, Pleasanton 15-minute Quadrangle, California, Scale 1: 62500.
U.S. Geological Survey, 1953, Niles 7.5-minute Quadrangle, California: scale 1:24,000.
U.S. Geological Survey, 1961 (photo revised 1980), Niles 7.5 Minute Quadrangle, California, Scale 1: 24000.
U. S. Department of Agriculture, 1961, No. 41, "Soil Survey Alameda Area, California", The Superintendent of Documents, U.S. Government Printing Office, Washington, D.C., 20402.
Wahrhaftig, Clyde, 1978, personal communication. Dr. Wahrhaftig was Professor of Geomorphology at U.C. Berkeley between 1967-82, and a senior geologist with the U.S. Geological Survey between 1943-67 and 1982-94.
Washington Township, County Club of, 1965, "History of Washington Township", Stanford University Press, 199 p.
Wong, I.G., Hempill-Haley, M.A., 1992, Seismicity and Faulting Near the Hayward and Mission Faults: in Borcherdt and others, eds., Proceedings of the Second Conference on Earthquake Hazards in the Eastern San Francisco Bay Area: CDMG Special Publication 113, p. 207-215.
Wood, M.W., 1883, History of Alameda County, California: M.W. Wood, Publisher, Oakland (reprinted 1969 by Holmes Book Co., Oakland), 1001 p.
Zaruba, Q., and V.C. Mencl, 1982, Landslides and Their Control, 2nd Ed: Elsevier Scientific Publishing Co., 324 p.
1 Although the "map distance" is only 4,550 feet, the actual traveled distance is computed accounting for curvature of flow and topographic relief. (Back)
2 Max Crittenden (1951) had originally mapped the Tularcitos Syncline in the Milpitas area, and Hall (1956, 1958) extended it northward into the Niles Quadrangle, where he showed it to be truncated by the Mission Fault. (Back)
3 This act was signed into law on December 22, 1972 and codified in the State Public Resources Code as Division 2, Chapter 7.5. It has been amended 10 times through 1994. California Code of regulations Title 14, Div. 2 provides policies and criteria set forth by the Mining & Geology Board to guide cities and counties in their implementation of the law. (Back)
4 These beds contain abundant fragments of shells, gastropods and mollusks cemented together, deposited in a near-shore environment. The type sections of the Briones were originally described by Trask (1922). (Back)
5 The sharp truncation of vertically-inclined Briones beds at the base on Mission Peak is strongly suggestive of faulting, east of the presumed trace of the fault, within the linear valley. Sudden shifts in bedding attitudes also exist preceeding eastward from Mission Ridge. (Back)
6 The elevations of this area were substantially altered by emergency channelization of Aliso Creek in September 1998.(Back)
7 Among his publications, in 1979 he co-authored "Relative Slope Stability for Land Use Planning - Selected Examples from the San Francisco Bay Region, CA", U.S. Geological Survey Professional Paper 944. (Back)
8 The appropriate offset would be a function of
the parent slide's size. The larger the parent slide, the greater the requisite
buffer zone. In some cases, substantially less than 1200 feet may be adequate.
(Back)