SAY, WHAT IS A 100-YEAR
FLOOD?
and
WHY DO WE HAVE SO MANY OF THEM?
J.
David Rogers, Ph.D., P.E., R.G., C.E.G., C.HG.
Karl F. Hasselmann Chair in Geological Engineering
Department of Geological Sciences & Engineering
Missouri University of Science & Technology
129 McNutt Hall, 1400 N. Bishop Ave.
Rolla, MO 65409-0230
We’ve all been there; glued to our TV sets watching
the roving reporter in their raincoat, soaked to the bone, providing their
“flood watch” by that troublesome spot that’s flooded so many times
before. After the water breaks out of
its channels, we’re told it was a “100-year flood”. Will it be another 100 years until it
happens again?
WHAT IS A 100-YEAR FLOOD
ANYWAY?
It is a probabilistic assessment that means a given event
has a one-in-one hundred chance (1 percent) of occurrence in any given
year, or a “return period” of once every 100 years. Such assessments are based upon statistical
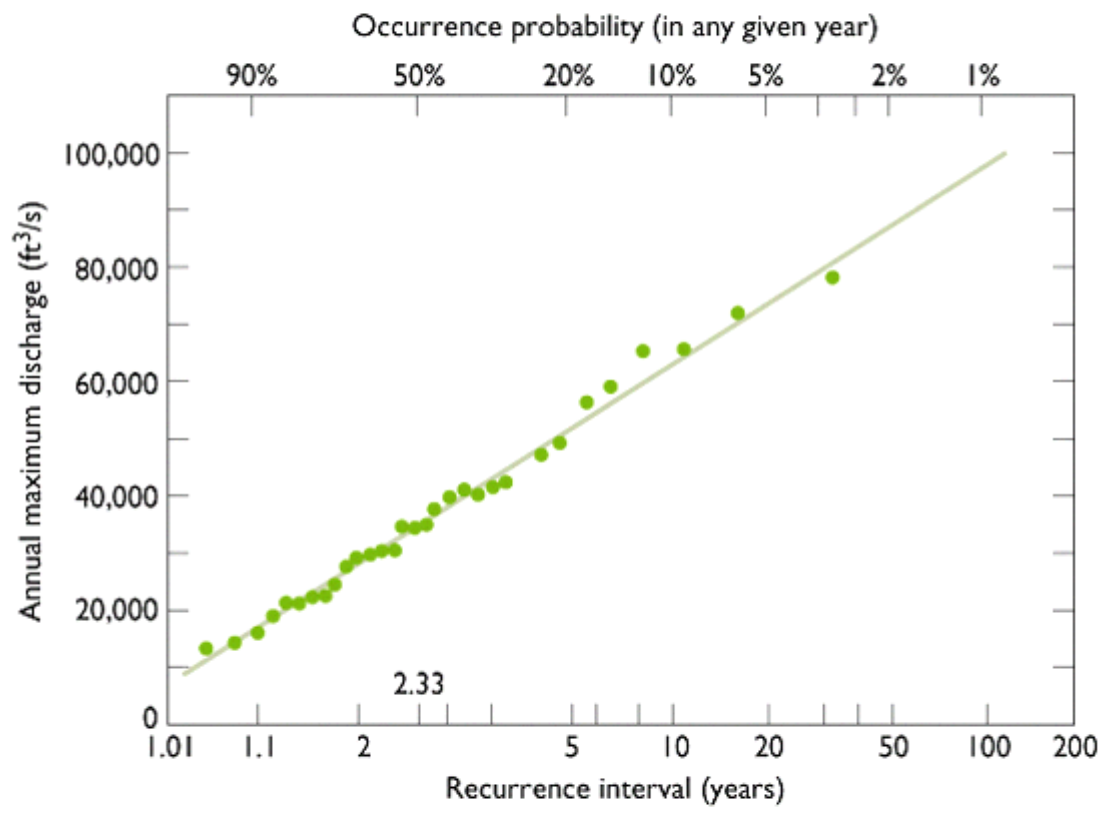
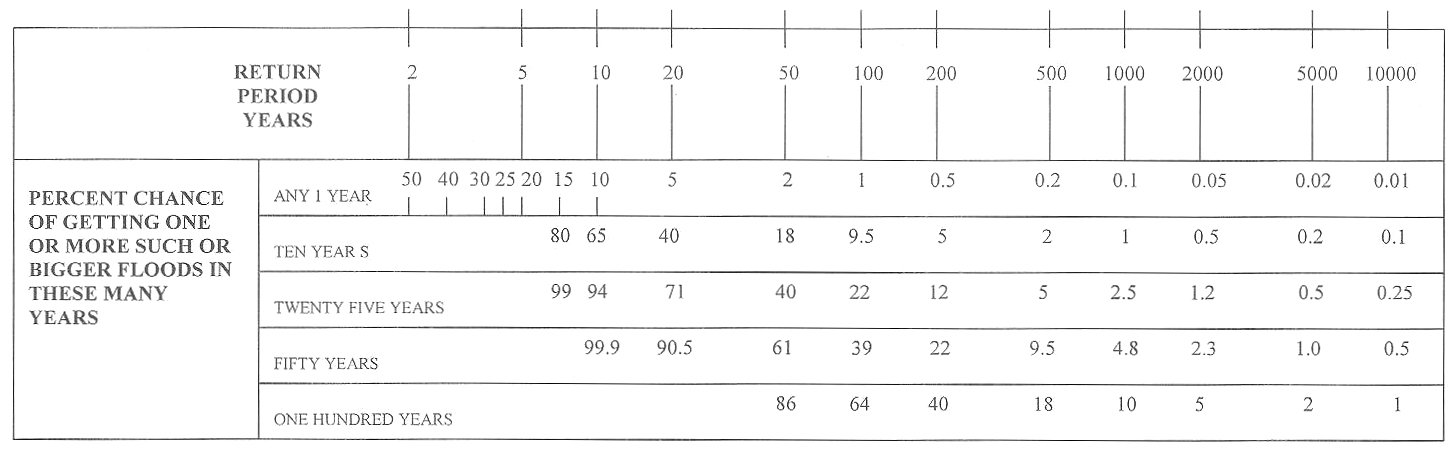
frequency of collected runoff data, as presented in Figure 1. The statsitical frequency of increasingly rare events
occuring is shown in Table 1. The reader can see from this table that
the 100 year return period storm has a 9.6% chance of occurrence in 10 years,
22% chance in 25 years, 39% chance in 50 years and
an 86% chance in 100 years.
So why do we hear so much about “100-year floods”?. In hydrology, there
are actually three types of comparative assessments: 1) rainfall within a
given time interval; 2)
peak stream flow (which is usually short-lived); or 3) volume of flow caused
by a single storm event or sequence of storms.
Each of these attributes can be measured and counted as discrete data
points, to provide statistical comparison, or frequency analysis.
As a consequence, we can have a 100-year storm, a 100-year peak flow
event, or a 100-year flood, all of which may or may not be independent of
one another. Although the media commonly use the terms “100-year
storm” and “100-year flood”, storm periodicity is always married to
some time interval, such as 24 hours, a week, a month or a water year.

Figure 1- Annual
maximum discharge frequency plot for the Skykomish River at Gold Bar, WA.
Data for each water
year is placed on a semi-log plot,
which assumes that statistically less-frequent data has a lower probability
of
occurrence.
Chow and Takase (1977) sugested that we would need 1000 years of record to
accurately predict
a 100-year frequency event.
PRECIPITATION
VS RUNOFF
A 100-year recurrence frequency rainfall event does
not necessarily precipitate a 100-year runoff, because runoff volume is
built upon a host of other contributory factors, the most important being
how saturated the ground already is when a storm hits. The more saturated the ground, the less moisture
it can accept, so more water will be available to coalesce
downslope and accrue in channels. This temporal
condition is usually referred to as the “runoff factor”(R). A runoff factor of 1.0 means 100% of the precipitation
would be shed as runoff. A coefficient of 0.50 would mean about half of the precipitation
could be expected to run off. Other
factors influencing runoff include the type of ground cover and vegetation,
terrain physiography, storm duration and changes
in precipitation intensity.

Table
1
If it were to rain more or less
continuously beginning in late October, by March we would begin to see extremely
high levels of runoff with even modest size storms, because the soil has absorbed
all the moisture it can within the given time interval.
This condition is refered to as “antecedent moisture”. The antecedent
moisture depends on how much precipitation a given afrea has receivd during
the past 2 to 3 months and how much of this moisture has already been absorbed
in the ground. Short-lived, but intense
bursts of rainfall usually do not cause widespread flooding, but can cause
debris flows and mudslides, which then flow downhill and clog drain inlets,
causing "secondary flood damage".
OROGRAPHIC LIFTING CAUSES IT TO
RAIN AND SNOW MORE IN HIGHER ELEVATIONS
Hydrologists have long recognized that clouds
dispel greater amounts of moisture over highland areas, due to
a phenomena known as “orographic lifting”, shown schematically in Figure 2.
Orographic effects cause much higher volumes of precipitation to accumulate
at higher elevations, while rainfall “shadows” develop in areas down-wind
of these same highlands. The shadow zones may receive as little as a quarter
or less of the highland precipitation. It
rains and snows in the mountains and it’s dry in the desert on the leeward
side. If the rate of orographic lifting >27 ft/sec (the average rate
of fall for rain), precipitation may be stored in the rising clouds, preventing
sloping foothills from receiving any rain. When the lifting rate slows <27
ft/sec, this "stored" precipitation is suddenly unleashed, fomenting
intense rates of precipitation (> 1 inch/minute), usually within the higher
elevations of the first significant ridge the storm encounters. This style
of storm is often responsible for deadly debris flows.
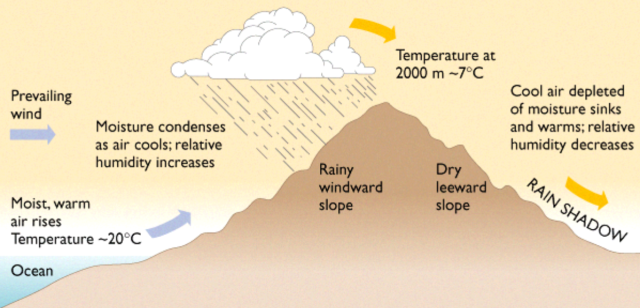
Figure 2
- Diagram illustrating orographic lifting of clouds over steep-sided
mountains and the rain shadow that tends
to develop
on the leeward side of the range. The upper elevations of the first sigtnificant
ridge usually receive the most
intense precipitation,
due to retained moisture if the clouds lift at a rate >27 fps.
IS THE RAIN FROM ANY GIVEN
STORM SEQUENCE ABOUT THE SAME EVERYWHERE?
No, local variations in rainfall intensity,
from one watershed to another, are startling because of localized “storm cells”,
as shown in Figure 3. For instance,
during the 8-day storm sequence ending at 4 AM on Friday January 3, 1997 in
California’s Sierra Nevada Mountains, 42.16 inches of precipitation was recorded
at Buck’s Lake (elevation 6,000 feet) in the Feather River Basin, while only
15.40 inches was measured during the same interval at Calaveras Big Trees
(elevation 4,900 feet). In the Feather River drainage an additional 8 inches of water was released
from snow melting because air temperatures were lower than in previous winter
storms. A record peak runoff of 330,000
cubic feet per second (cfs) was recorded on the
Feather River just above Oroville Reservoir. Even though the peak runoff was greater than
a 100-year recurrence frequency event, the other two measures, such as flood
volume (less than 1982-83) and rainfall (less than December 1955) were not
records.
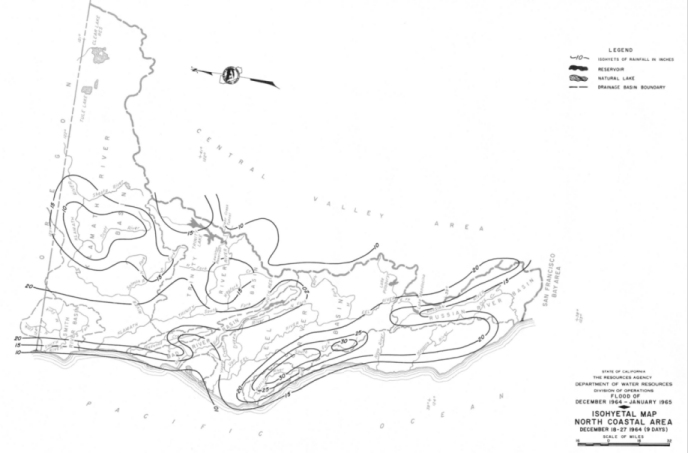
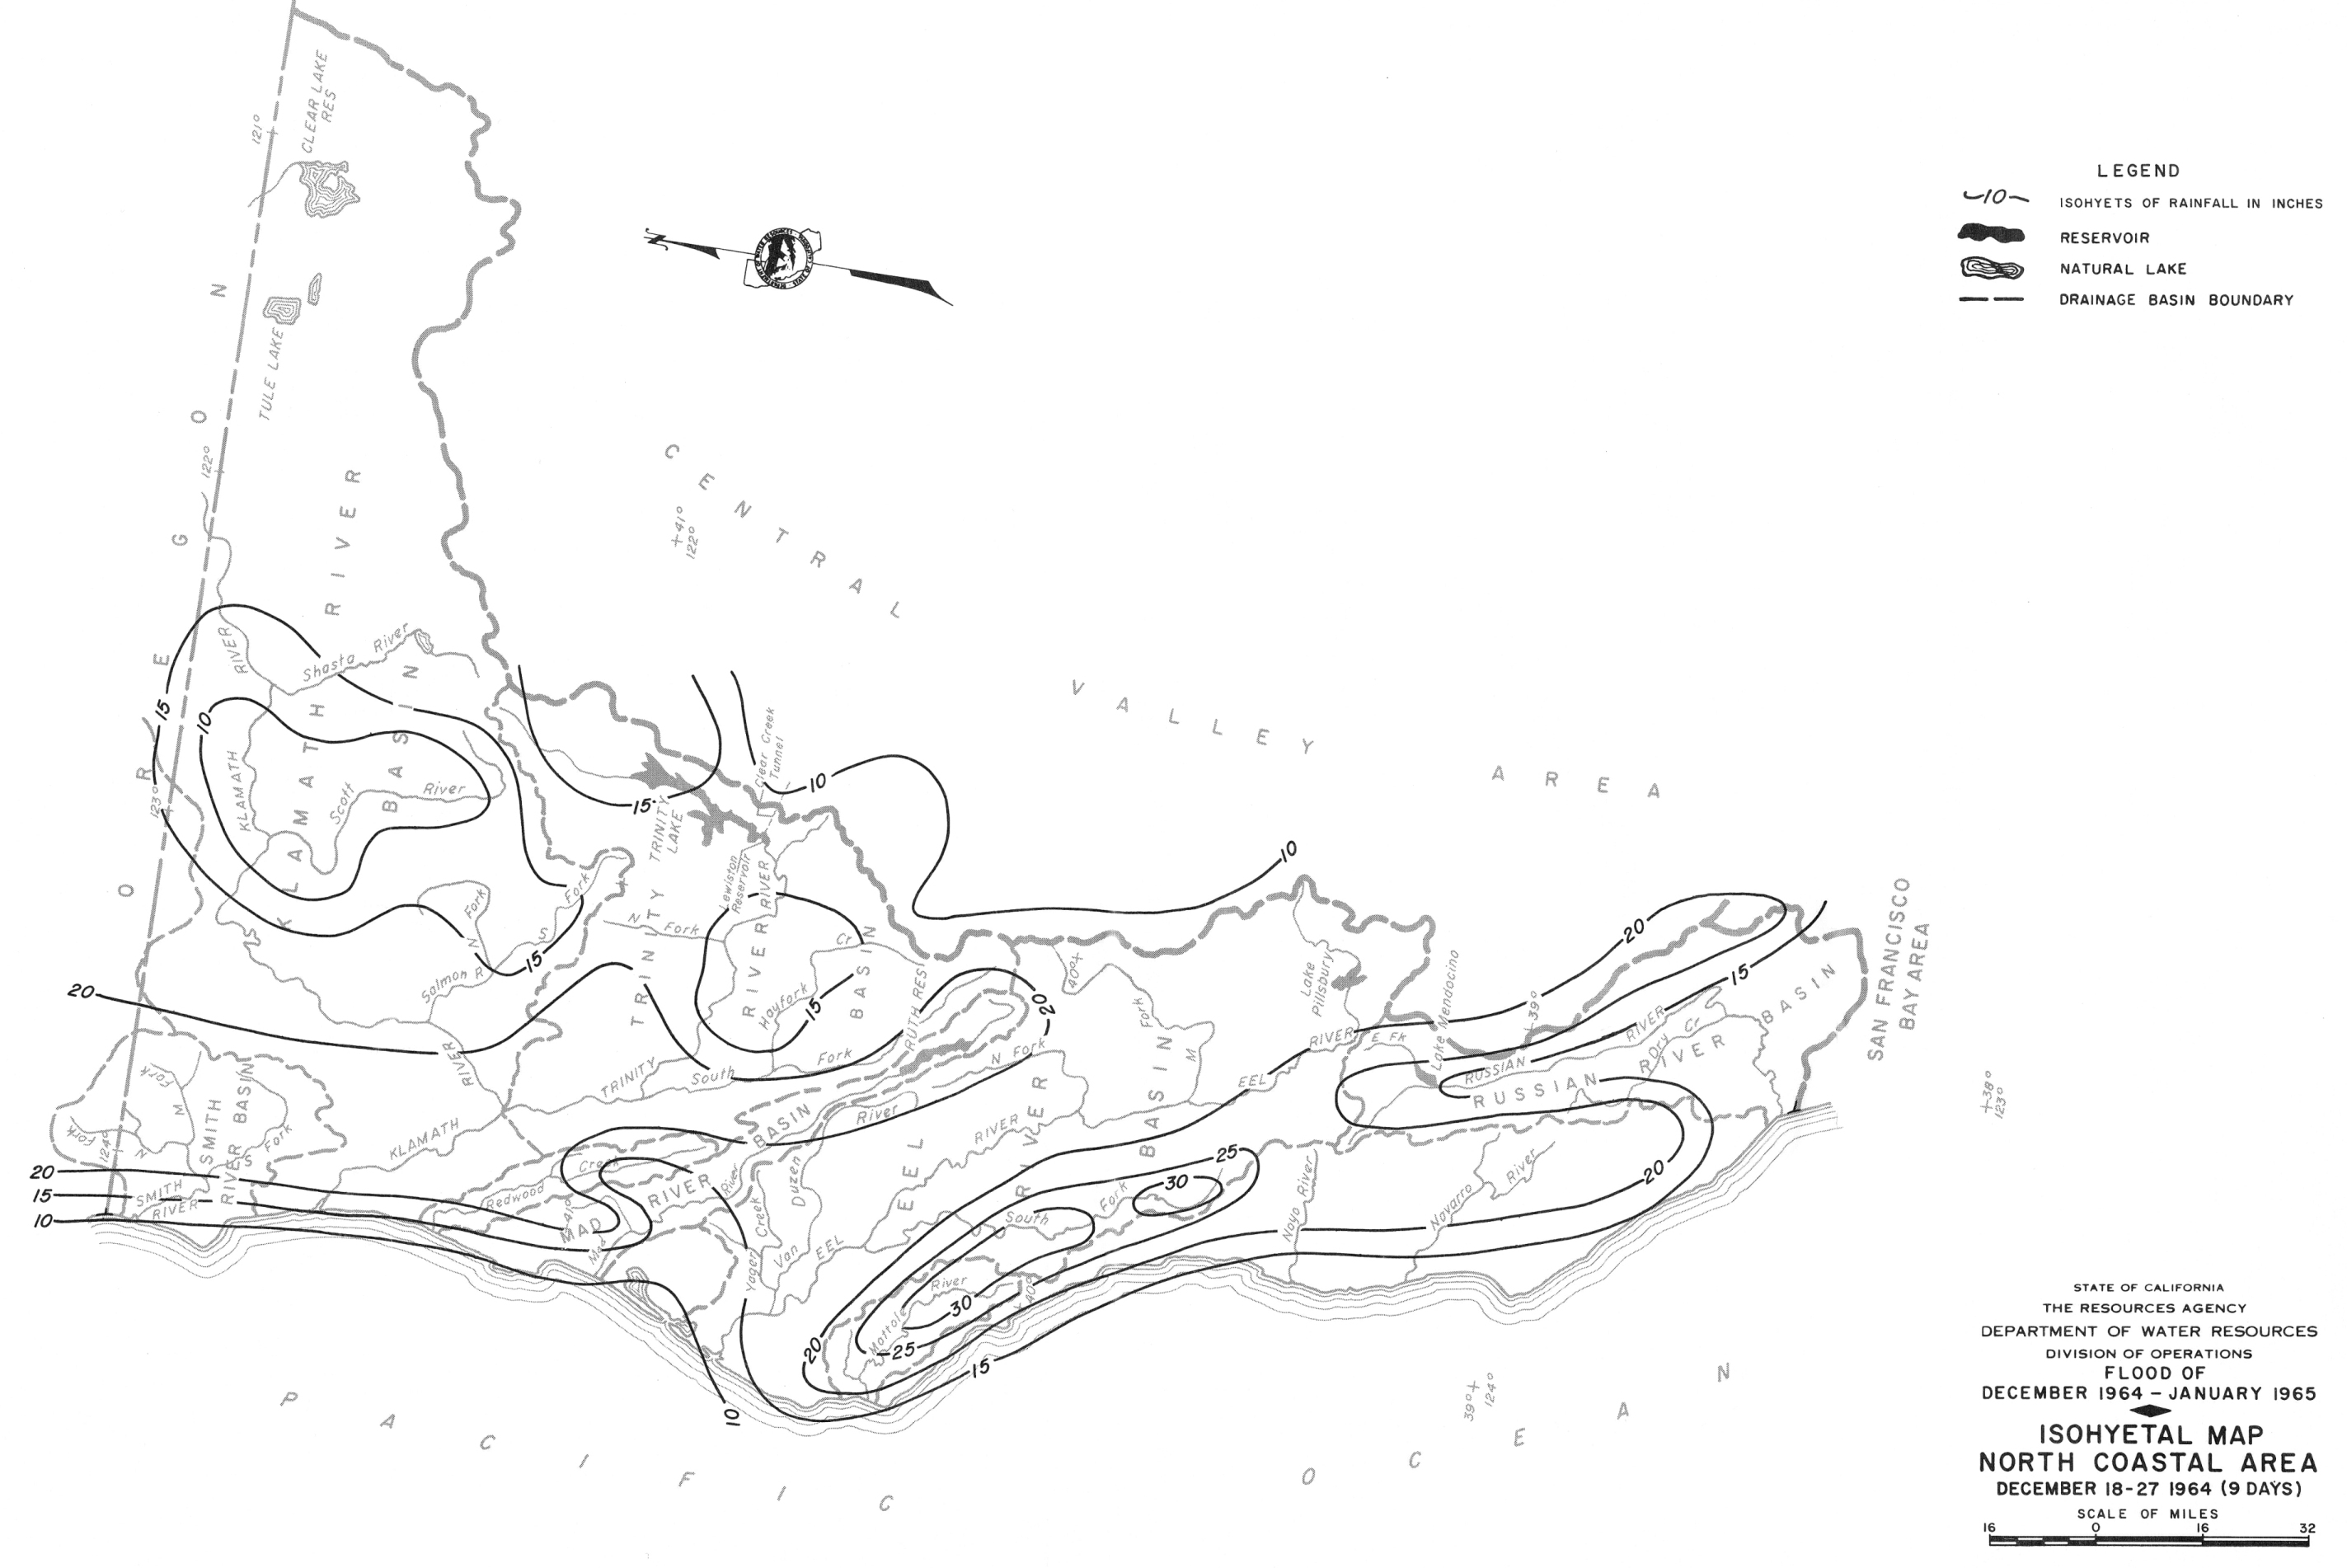
Figure 3 - Isohyetal
map of 9-day storm sequence between Dec 18-27, 1964 along the north coast
of California. A 300% variation in recorded
precipitation is not uncommon
during extreme events, because of "cell effects" and intermittent
stalling of the advancing storm front.
WHAT IS THE STORM-OF-RECORD
?
The storm-of-record is the greatest level
of precipitation ever recorded, for a given time interval. The 24-hour storm-of-record in the San Francisco East Bay area occurred on October 13, 1962, when 9.4 inches fell in a single day in the Oakland
Hills, with 13.73 inches recorded in 48 hours.
This storm precipitated considerable flooding of downtown Oakland,
but did not trigger any damaging debris flows because of low antecedent moisture
(it was the forst significant storm of that water year).
If the same storm had hit in March or April, after the ground were
saturated, the resultant landslippage and debris flows would have been much
worse.
STORM DURATION USUALLY
CONTROLS DESTRUCTIVE RUNOFF
The other complicating factor is the duration
of the storm. Along coastal California
the average storm duration is only about 1.5 hours.
On January 3-5, 1982 a subtropical storm hit central California, but its forward motion was stalled by a high pressure
area sitting over the Sacramento Valley. The result was a 30-hour duration event that dumped
upwards of 27 inches of rain on coastal highlands bordering the San Francisco
Bay Area. Although the volume of moisture recorded over
24 hours didn’t break the October 1962 record, the 30-hour totals were records,
culminating in a series of debris flows and causing 17 deaths and millions
of dollars in damage in the Bay Area.
For the north coast area of California the December 1964
storms caused record flows, including a record flow of 900,000 cfs
on the Eel River, just below its confluence with the Van Duzen
River. The previous record had been
500,000 cfs, recorded in December 1955. The 1964 flood was precipitated by only 4 days
of rainfall, with as much as 24 inches in 48 hours recorded at Laytonville, but the storms came in the midst of an already
wet winter.
WHAT DOES THE FUTURE HOLD?
We will have more 100-year rains, floods and
peak flows. In 1977 one of the founding
fathers of channel hydraulics, Professor Ven Te
Chow of the University of Illinois, reminded the civil engineering profession that in order to accurately
predict a 10-year recurrence frequency event, we would need 100 years of records,
which is about what we have today. But,
in order to accurately predict a 100-year recurrence event, we would need
1,000 years of records, which we do not have. Flood predictions, like those of the weather,
depend an unique set of environmental variables which are almost never
repeated, meaning the one thing upon which WE CAN count is that the results of any given storm will
always be different.
So, you know of some property along the Osage River that hasn’t been flooded since 1937?
That might actually mean your chances of disaster are increasing each
year. My advice would be don’t buy it without a boat.
REFERENCE:
Ven Te Chow and Nobutada Takase, 1977, Design Criteria for Hydrologic Extremes: Journal
of the Hydraulics Division, American Society of Civil Engineers, v. 103,
N. HY4 (April), pp. 425-436.
J. David Rogers is the Karl F. Hasselmann
Missouri
Chair in Geological Engineering
at the Missouri University of Science & Technology. He
received his B.S. in geology from the
California State Polytechnic University
in 1976, M.S. in civil engineering from U.C. Berkeley
(1979) and Ph.D. in geological and geotechnical engineering from U.C. Berkeley
in 1982. Between 1979-2001 he served
as a principal with three different geotechnical consulting firms and from
1994-2001 he served on the faculty of the Department of Civil & Environmental
Engineering at the University of California at Berkeley. His career has focused on natural disasters
associated with earth movement, floods and earthquakes. The author of over
100 articles, he is a recipient of the Rock Mechanics Award of the National
Research Council, the E.B. Burwell Award of the Geological Society of America
and the R.H. Jahns Distinguished Lecturer Award
of the Association of Engineering Geologists and Geological Society of America,
for his contributions to geoforensics,
with particular emphasis on the failure of dams and levees. He can be reached at rogersda@mst.edu
Questions
or comments on this page?
E-mail Dr. J David Rogers at rogersda@mst.edu.