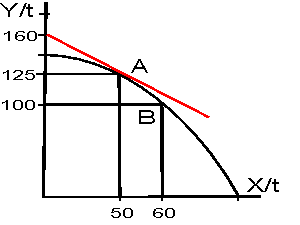
If you are at a point on the frontier,
know how to measure the opportunity cost, or marginal cost (MC), of one added
unit of either good. What is the cost of moving from one point on the frontier
to another? What does the shape of the PPF imply about the degree to which
resources are substitutable?
To determine the cost of one more unit of a
good, you must know the slope of the production possibilities frontier. If the
frontier is linear, the slope is just the rise over the run. For example if the
slope is -1/3 this means the giving up of one good on the vertical axis, say 1
Y, allows us to get 3 more of the goods on the horizontal axis, say 3 Xs. The
marginal cost of X is the absolute value of the slope, in this case 1/3 unit of
Y. The marginal cost of the good on the vertical axis is the inverse of the
absolute value of the slope, in this case, the marginal cost of Y is 3 units of
X.
 If the PPF is
concave, or bowed out from the origin, you must draw a tangent
to the PPF at the point where you what to determine the marginal cost of X or Y.
The absolute value of the slope is the marginal cost of the good on the
horizontal axis and the inverse of the absolute value of the slope is the
marginal cost of the good on the vertical axis. In the diagram, at point A the
slope of the PPF is -35/50 = -0.7. We would say the marginal cost of X at point
A is 0.7 a unit of Y. And, the marginal cost of Y at point A is 1 and 3/7th
units of X.
The cost of moving from point A to point B is the number of Y units given up.
In this case, the cost of 10 units of X (from 50 to 60) is 25 units of Y. We can
also calculate the average cost of an X going from point A to point B. The
average cost is total cost divided by the number of Xs gained. Here, the average
cost of an X is 2.5 units of Y.
The degree to which resources are substitutable is implied by the shape of
the PPF. If the PPF is linear, resources are perfectly substitutable. If
the PPF is concave, resources are substitutable, but not perfectly. When
resources are not perfectly substitutable, the marginal cost increases as
production increases. In the diagram above, the marginal cost of X at point A is
less than the marginal cost of X at point B. This is reflected in a steeper
slope of the tangent at B compared to the tangent at point A.
 If the PPF is
concave, or bowed out from the origin, you must draw a tangent
to the PPF at the point where you what to determine the marginal cost of X or Y.
The absolute value of the slope is the marginal cost of the good on the
horizontal axis and the inverse of the absolute value of the slope is the
marginal cost of the good on the vertical axis. In the diagram, at point A the
slope of the PPF is -35/50 = -0.7. We would say the marginal cost of X at point
A is 0.7 a unit of Y. And, the marginal cost of Y at point A is 1 and 3/7th
units of X.