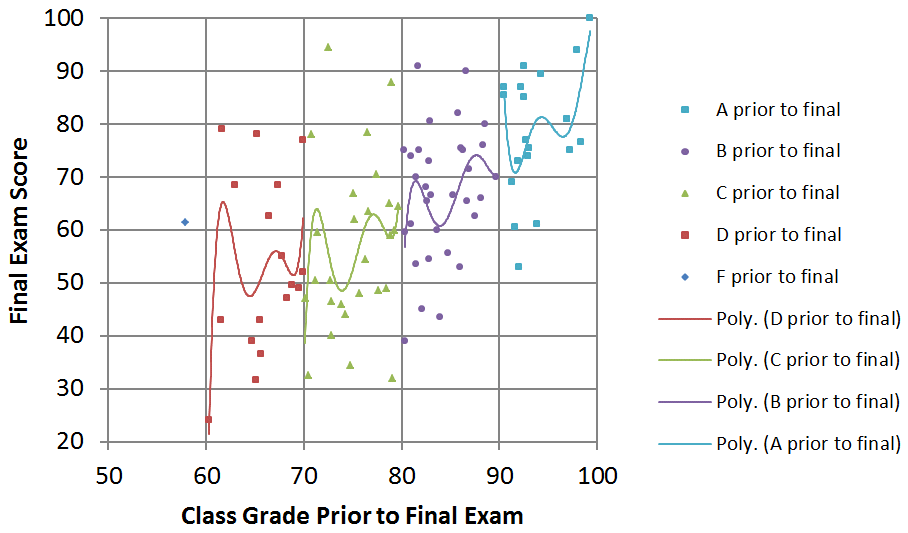
Spring 2014 Sections 1C and 1D Grades
| Quiz 1 | Quiz 2 | Quiz 3 | Midterm Grade |
Quiz 4 | Quiz 5 | Quiz 6 | Quiz 7 | Final Exam |
Class Grade |
|||
| WileyPLUS usage per student (hr) | 8.8 | 11.3 | 11.3 | -- | 13.4 | 10.8 | 7.1 | 11.4 | -- | -- | ||
| Class site usage per student (hr) | 2.2 | 4.6 | 2.5 | -- | 3.3 | 2.5 | 1.8 | 1.8 | 1.2 | -- | ||
| Average resource usage per student per class period* |
Time on site (min.) | 43 | 92 | 50 | -- | 49 | 50 | 37 | 37 | -- | -- | |
| Site visits | 3 | 8 | 4 | -- | 3 | 4 | 3 | 3 | -- | -- | ||
| Unique pageviews | 15 | 33 | 19 | -- | 16 | 19 | 12 | 12 | -- | -- | ||
| Scores | High | 100 (9) | 100 (5) | 100 (2) | 99.7 | 97.3 | 103.75 (3) | 100 (5) | 100 (8) | 100 | 100 | |
| Average | 80 | 73 | 86 | 82.4 | 62 | 71 | 84 | 75 | 64 | 77 | ||
| Low | 36 | 22 | 44 | 31.8 | 17 | 27 | 47 | 31 | 24 | 18 | ||
| Curve | 7.5 | |||||||||||
| Number of scores in a particular range |
100-90 | 42 | 14 | 63 | 34 | 8 | 20 | 29 | 22 | 6 | 15 | |
| 89-80 | 24 | 31 | 21 | 41 | 20 | 13 | 39 | 23 | 10 | 31 | ||
| 79-70 | 18 | 18 | 15 | 16 | 11 | 23 | 20 | 17 | 22 | 27 | ||
| 69-60 | 10 | 28 | 7 | 9 | 23 | 16 | 6 | 16 | 22 | 23 | ||
| 59-50 | 11 | 8 | 2 | 5 | 10 | 19 | 3 | 12 | 12 | 2 | ||
| 49-40 | 7 | 6 | 3 | 2 | 13 | 5 | 1 | 7 | 15 | 1 | ||
| 39-30 | 3 | 3 | 2 | 11 | 4 | 3 | 7 | 1 | ||||
| 29-20 | 2 | 6 | 2 | 1 | 1 | |||||||
| 19-10 | 2 | 1 | ||||||||||
| 9-0 | ||||||||||||
* Does not include textbook, WileyPLUS or MecMovie usage.
| Semester | Final Exam | Difference | |
| Rolla | Springfield | ||
| 2014 W | 69 | 38 | 31 |
| 2013 F | 59 | 42 | 17 |
| 2013 W | 62 | X | |
| 2012 F | 66 | 54 | 12 |
| 2012 W | 63 | X | |
| 2011 F | 69 | 62 | 7 |
| 2011 W | 72 | 70 | 2 |
| 2010 F | 71 | 66 | 5 |
| 2010 W | 62 | 63 | 1 |
| 2009 F | 63 | X | |
| 2009 W | 72 | X | |
| 2008 F | 65 | X | |
| Number of people with the same midterm and semester grades | 61 | 60% |
| Number of people that went up one letter grade | 2 | 2% |
| Number of people that went down one letter grade | 34 | 33% |
| Number of people that went down two letter grades | 4 | 4% |
| Number of people that went down three letter grades | 1 | 1% |
| Chapter | Spring 2014 | Fall 2013 | Average Homework Score |
Change in Grade |
Average Homework Hours |
Change in Hours |
Average Homework Score |
Average Homework Hours |
| 1 | 94 | +4% | 4.5 | -21% | 90 | 5.7 |
| 2 | 95 | +7% | 2.5 | -4% | 89 | 2.6 |
| 3 | 94 | +6% | 1.8 | -10% | 89 | 2.0 |
| 4 | 89 | 0% | 3.7 | -26% | 89 | 5.0 |
| 5 | 66 | -1% | 7.4 | -26% | 67 | 10.0 |
| 6 | 77 | -1% | 8.4 | +6% | 78 | 7.9 |
| 7 | 85 | -3% | 2.9 | -58% | 88 | 6.9 |
| 8 | 67 | -11% | 6.3 | -37% | 75 | 10.0 |
| 9 | 65 | -2% | 3.8 | -32% | 66 | 5.6 |
| 10 | 55 | -32% | 3.3 | -54% | 81 | 7.1 |
| 11 | 76 | +31% | 6.9 | -5% | 58 | 7.3 |
| 12 | 86 | +5% | 3.9 | -35% | 82 | 6.0 |
| 13 | 92 | +7% | 4.8 | -10% | 86 | 5.4 |
| 14 | 93 | -1% | 2.4 | -23% | 94 | 3.1 |
| 15 | 74 | +9% | 9.3 | +2% | 68 | 9.1 |
| 16 | 87 | -- | 2.0 | -- | -- | -- |
| Average/Total | 86 | +9% | 60.5 | -14% | 79 | 70.1 |