Only in the very simplest loading situations can we calculate the theoretical state of stress at a point in a loaded member utilizing a single stress formula (e.g.
or
). In many cases however, we can use superposition and predict the contributions to the state of stress at a point by adding the effects of centric axial loading, bending, torsion, and transverse shear.
In this experiment we shall examine a loading situation where the stress state is caused by the combined effects of axial loading and bending. We shall eccentrically load a rectangular block of aluminum and measure the axial strains at several locations on the member. These strains can be multiplied by the modulus of elasticity to obtain the stress state, since the stress on the differential element is uniaxial.
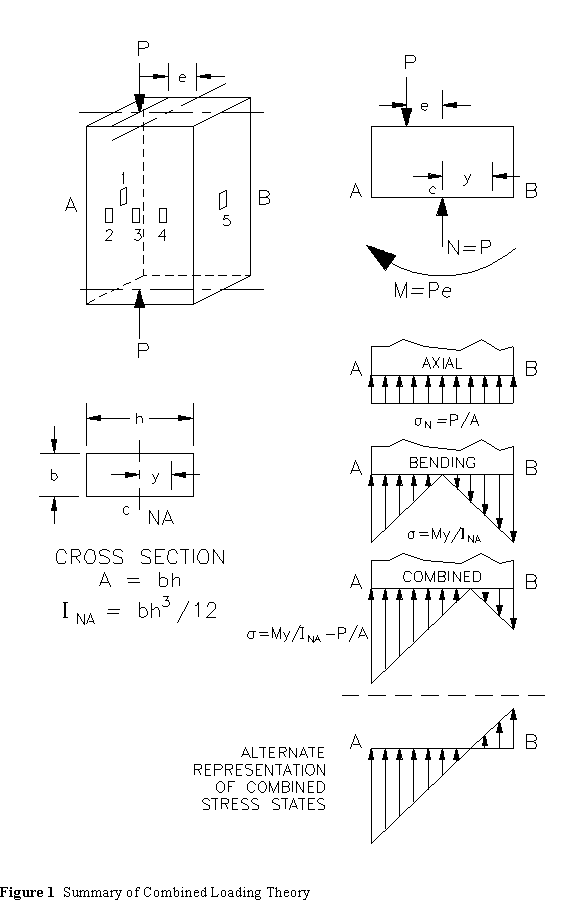
We can predict the theoretical state of stress at any point on the cross section by adding the effects of uniaxial centric loading and centroidal bending.
Finally, we will compare the results obtained from theory with those obtained experimentally.
Although it is not necessary, we will load on one axis of symmetry at an eccentric distance e from the centroid. This allows us to reduce the problem to a two dimensional problem since the stresses (and strains) should be constant through the thickness. The loading and relevant theory are summarized in Figure 1.
- Measure, and record on a sketch, the gage locations, the loading point and the specimen dimensions.
- Measure and record the axial strains for a single load assigned by your instructor. (We could record the strains as a function of loading, but that would give a very large set of data to work with.) The modulus of elasticity will be supplied by your instructor.
