Objectives
The objectives for the tension test for elastic constants are:
- To demonstrate the axial and lateral strain versus load relationships for an assumed simply elastic material.
- To familiarize the student with electrical resistance strain gages for measuring deformation in a uniaxial tensile test.
- To determine the modulus of elasticity and Poisson's ratio. From these two, we can calculate the modulus of rigidity.
Fortunately, many engineering materials exhibit a linear elastic range of response to loading. Also, many engineering materials can be assumed to be homogeneous and isotropic within that linear range. Let us review the definitions of the terms above:
Linear - straight line relationship between load and deformation (or stress and strain),
Elastic - deformation is fully recoverable when the loading is removed,
Homogeneous - the structure or composition is uniform (constant) throughout the material,
Isotropic - the properties are the same in all directions.
Although most materials do not strictly satisfy the requirements to be homogeneous, isotropic, linear-elastic materials, many are sufficiently close to allow us to assume they act that way. For example, steel has some directional properties imparted to it in the rolling or drawing process yet we can generally assume it is essentially isotropic.
Materials which are assumed to satisfy the four definitions above are frequently referred to as simply "elastic" materials. Therefore if no modifiers are added to the term we shall assume "elastic" implies that the material is a "homogeneous, isotropic, linear-elastic material".
In the study of elastic materials, we find the material response equations (stress-strain equations, also called constitutive equations) are generally given in terms of the elastic constants:
E = modulus of elasticity (Young's modulus)
ν = Poisson's ratio, and
G = modulus of rigidity (shear modulus).
These elastic constants are usually defined under very simple loading conditions. A uniaxial stress state is used to define the constants E and v, while pure shear is used to define G. However, these same constants appear in the more general stress-strain relationships for elastic materials: the generalized Hooke's law.
It appears that we need to determine three elastic constants in order to completely define the stress vs strain response of such a material. It can be shown however that only two of the elastic constants are independent. If we know any two we can calculate the third using the relationship:
E = 2 (1 + ν) G.
Actually, you may encounter a couple of additional elastic constants: bulk modulus K, and Lame's constant
. Still there are only two independent elastic constants, and any one can be expressed in terms of any two of the other constants.
We have previously seen how we can determine E (modulus of elasticity) from a tensile test. With proper instrumentation we can also determine Poisson's ratio from the tensile test.
Poisson's ratio is defined as the negative of the ratio of the lateral strain to the axial strain for a uniaxial stress state:

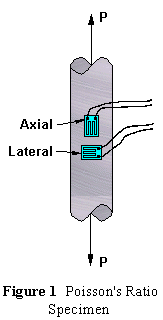
You may also see it defined as the ratio of the absolute values of lateral and axial strain. In this experiment we shall employ either electrical resistance strain gages or a biaxial extensometer to measure the axial and lateral (circumferential) strains on a uniaxial tensile specimen (Figure 1). These values along with load will permit us to directly determine E and v. The modulus of rigidity G may then be determined indirectly using the relationship between the elastic constants.
- Option a) Set up a data sheet with space to record the
two strain values for each of 10 loads. Be sure to also
record information about your specimen, the date and
other pertinent information.
Option b) Use automatic data acquisition equipment to collect and store data. Pertinent information about the experiment should be stored with the data set. Place an instrumented 5/8 inch diameter specimen (either steel or aluminum) in the testing machine.
- Connect wires as necessary to allow you to monitor the two strain values using a switching-balancing unit and strain indicator or the automatic data acquisition equipment. Be sure to set your gage factor on the strain indicator.
- Option a) If you are manually recording data, record load
and the two strain values for ten load values. Load in
steps of 1000 pounds for a steel specimen, or 500 pounds
for an aluminum alloy.
Option b) For automatic data acquisition, limit maximum strain values to 2900 micro strain (strain indicator limit). This will correspond to about 9000 pounds for an aluminum alloy of 5/8 inch diameter.
NOTE: If the strain indicator saturates the computer will stop taking data and display an error message on the monitor. Manually terminate the data acquisition (F12) and then unload the specimen.
Plot two graphs:
- stress vs axial strain and
- absolute value of circumferential strain vs axial strain (note that circumferential strains are negative).
Determine the slopes of the two curves using the method of least squares. Be sure to show the least square lines on the graphs.
The slopes of the curves are the modulus of elasticity and Poisson's ratio.
The least squares slope of the stress vs axial strain curve will give you the E value.

And the slope of the second curve gives you Poisson's ratio:
Calculate the modulus of rigidity G from the values of E and v which you obtained.

Mechanics of Materials, by Higdon et al., 4th Ed., Wiley, 1985, pp 80-83, 89-96, 99-104.
Mechanics of Materials, by Hibbeler, Macmillan, 1991, pp 79-91, 99, 101.
Mechanics of Materials, by Hibbeler, 2nd Ed, Macmillan, 1994, pp 83-99.
