Table XXIV. Formulas for Calculating Titration Data, pH vs. mL of Reagent
M0 its Molarity |
V1 ml. of Reagent of M1 Molarity Added |
V1 Volume Reagent M1 its Molarity VT Total Volume | ||
| (1) Strong Acid | [H+]=M0 |  |  |  |
| (2) Strong Base | [OH-]=M0 |  |  |  |
| (3) Weak Acid (Ka=10-5 to 10-8) |  |  |  |  (Value in Column 4 to be added) |
| (4) Weak Base (Kb=10-5 to 10-8) |  |  |  |  (Value in Column 4 to be added) |
| (5) Salt of Very Weak Acid (e.g. KCN) |  |  |  |  (Correct for value in Column 4) |
| (6) Salt of Very Weak Base |  |  |  |  (Add to [OH-] found in Column 4) |
 pH vs. mL of 0.1 N NaOH in the Titration of 25 mL. of 0.1 N of HCl. the shaded blocks show the transition ranges of the indicators. Strong Acid/Strong Base |
 Graphs showing the course of pH vs.mL of 0.1 N NaOH in the titration of 25 mL portions of various acids of the Ka values indicated (10-4, 10-5, 10-6, etc.). Weak Acid/Strong Base |
 Graphs showing the course of pH vs. mL of 0.1 N HCl in the titration of 25 mL portions of bases of Kb 10-5, 10-7, 10-9. Strong Acid/Weak Base |
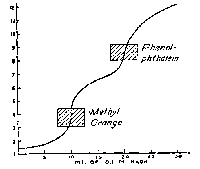
 The course of pH during the titration of 30 mL of 0.1 Molar phosphoric acid with 0.1 N sodium hydroxide. Polyprotic Acid/Strong Base |