NE-312
Radiation Detection and Measurements Laboratory
Counting Statistics and Error Prediction
Equipment
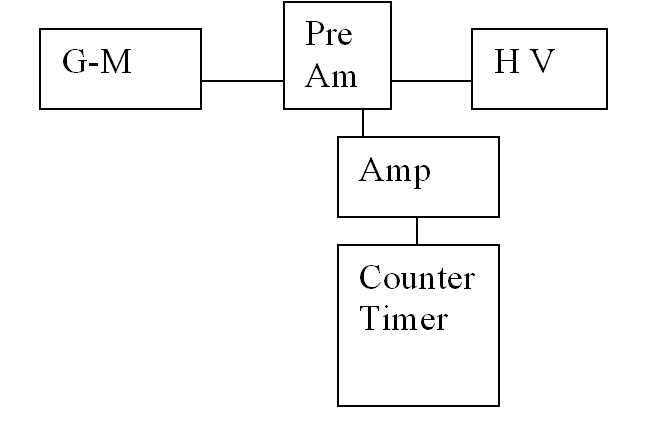
Setup Lab Setup diagram
- Turn on the NIN Bin power supply
- Slowly raise the voltage to 500 volts (or the amount the instructor tells you)
- Set the Counter-Timer to collect for the required time and press th reset button. Also verify that you are on the correct channel
- Set the amplifier to the lowest course gain and the fine gain to zero or as low as it will go. (These depend on the model used.
- Place a source by the detector and start the counter-timer to verify that it is giving counts. If not raise the course gain one setting and try again. Repeat until you get a good count.
Procedure
- Taking a sample of data
- Record 20 background readings, for 60 seconds each.
- Place a source in front of the detector and record 20 more one minute counts.
- For steps a) and b) calculate Experimental Mean and Sample Variance
- Analysis of Data Set
- If we believe the data are subject to Poisson fluctuations, the expected standard deviation for one typical measurement should be
- (Since X is approximately the same as any typical value). If the data fits the Poisson model, then your experimentally measured S should be approximately the same as the calculated s. Comment on the significance of s in this application
- Apply the c2 test to the sets of data obtained in steps “1” and “2”. What is your p value in each case? (You should use figure 3.11 from Knoll)
- Using this information, calculate the expected standard deviation of the mean value X determined in step “1”. Write down your interpretation of the significance of this value in comparison to the sample standard deviation.
- ALARA in Action
- To see the effects of detector-source geometry (and one of the ALARA principles), take several counts at various measured distances from the detector. How does the net count rate change with respect to the distance from the detector? Use this data to plot a trendline of the count rate vs. distance from the source. How would you use error propagation techniques for this trendline?