A Hardware-Software Debugging Interface
for the 8051
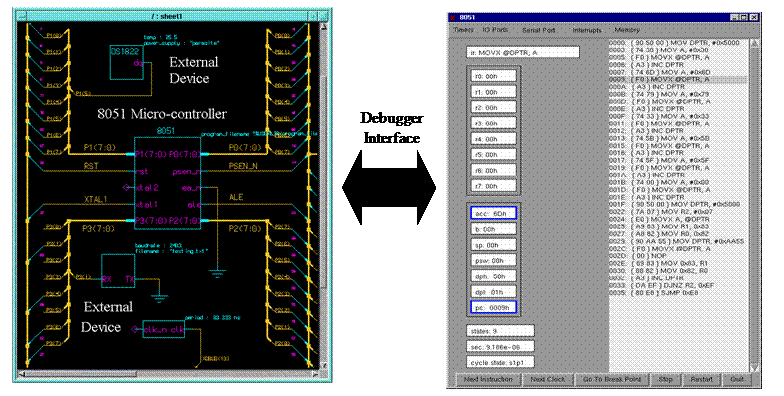
A
special-purpose Hardware-Software Debugging interface was designed to work with
our 8051 VHDL model and with Mentor Graphics design automation tools. The interface allows the user to look at
what’s going on inside the 8051 and at values in memory while stepping through
their code and simultaneously co-simulating their software and hardware. The interface shows the contents of code
memory, the current instruction, and the current values of internal registers
like the instruction register, PSW, ACC, and more (see Figures below). The user can set break points or may
optionally bring up additional windows to view external or internal memory
blocks, or to view information about timers, I/O ports, interrupts, or the serial
port. The interface actively issues commands
to and reads results from Mentor Graphics simulation tools, so all simulation
results are generated by Mentor Graphics from the interaction between the
user’s software and hardware designs. To
get a copy of the Tcl/Tk 8051 debugger, please proceed to our models page.
For additional information about the model, see:
§
L. Verma, H. J.
Pottinger, and D. G. Beetner, "A Software Debugger Interface for an 8051
Hardware Model," 2003 Conference on
Microelectronic Systems Education, June 2003.
§
L. Verma, D.
Beetner, H. Pottinger, “A Tcl/Tk Debugging Interface for a VHDL 8051
Microcontroller Model,” Mentor Graphics Users Group 2003 conference proceedings,
2003.
§
L. Verma, Development of Educational Materials Teaching
Hardware-Software Co-Design: Laboratories and A Debugger Interface for an 8051
VHDL Model, Masters thesis, University of Missouri-Rolla, 2003. (Chapter 3: A
hardware-software debugger interface).
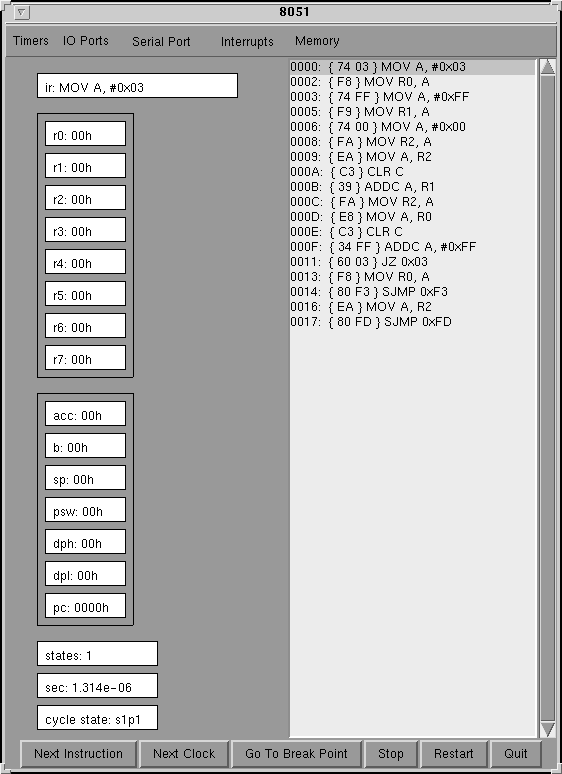
Figure 1. The user may view the contents of internal
registers while executing instructions one instruction-cycle or one clock-cycle
at a time.
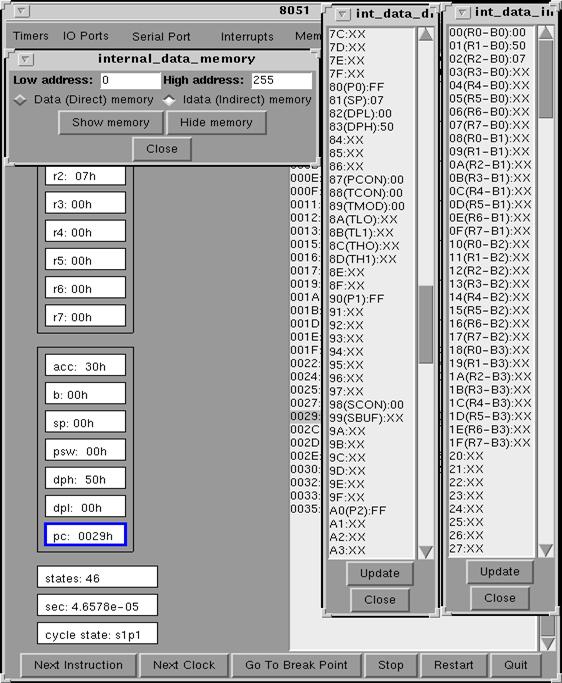
Figure
2. Users may bring up additional windows to view internal or external memory
blocks or to view status of timers, I/O ports, interrupts, or the serial port.